VeilGEX
Dealer gamma exposure by strike on SPX and NDX — the flip, the walls, the expected move — read in the contract you trade.
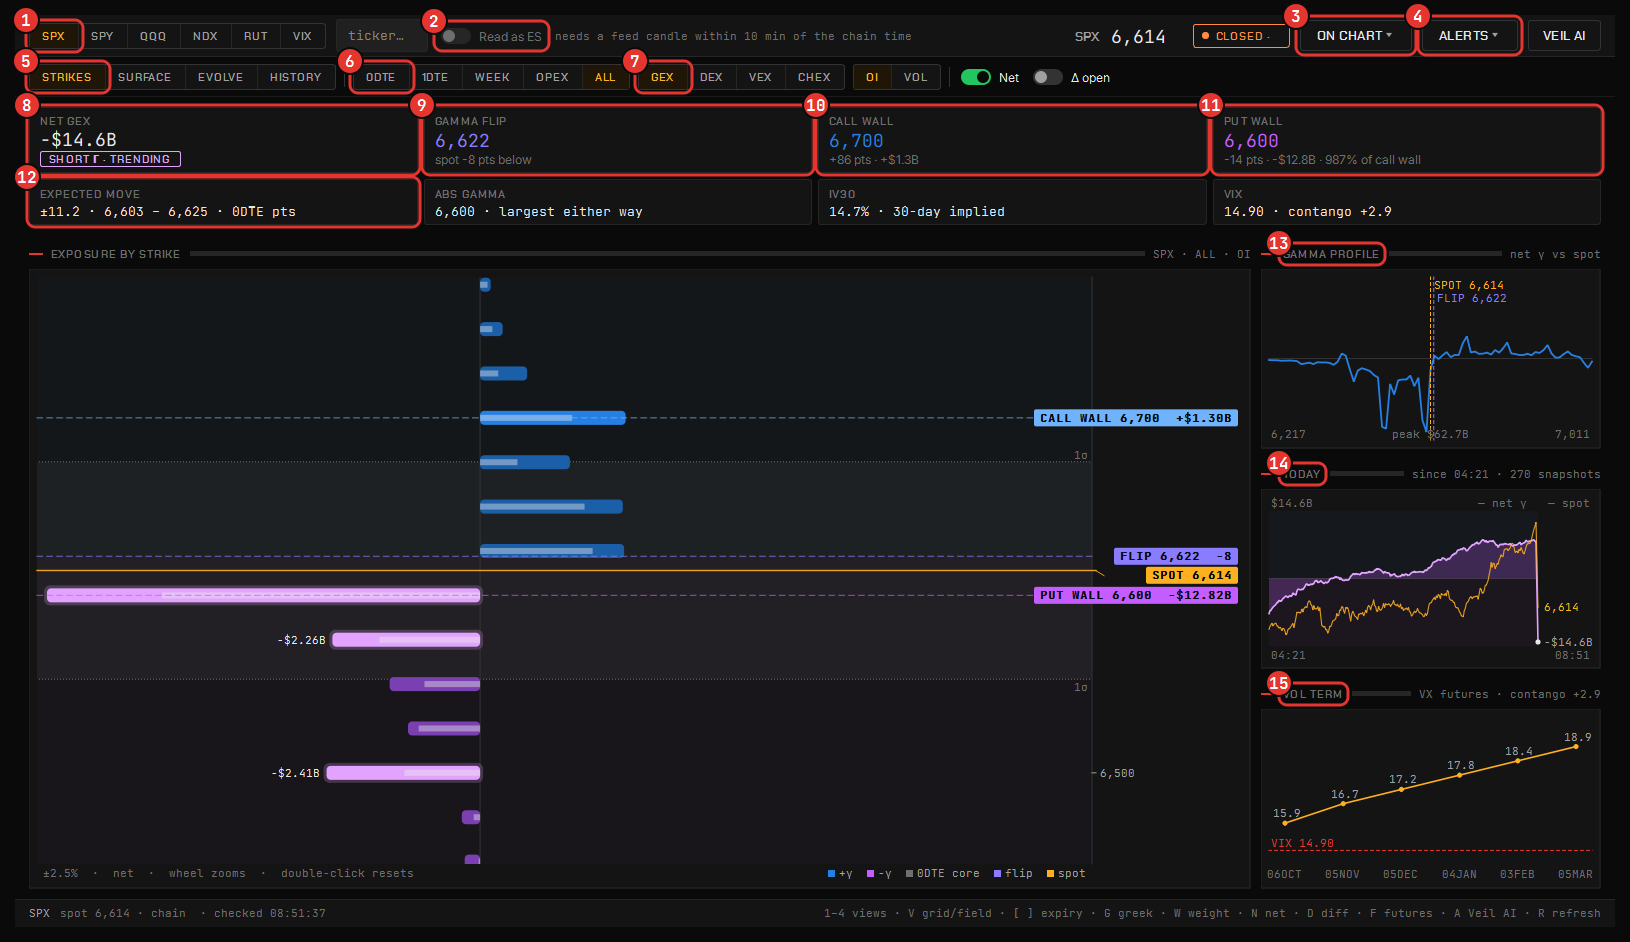
VeilGEX shows dealer gamma exposure by strike on SPX and NDX — the indices behind the futures the rest of the platform is built for — with the flip point, the call and put walls, vanna and charm, the expected move and the volatility curve. Heavy positive gamma tends to damp movement as dealers hedge against it; past the flip it amplifies.
GEX is context about positioning, not a signal. Chartveil does not issue signals or advice, and gamma exposure is an input to your own read, not a substitute for one.
Data
The terminal retrieves delayed options-chain data itself, so nothing extra is needed. Positioning is context that develops over hours, so delayed data carries it honestly. If you already pay an options-data provider, paste its key under Data feed → Options data and the window uses that instead. The header says in words whether the chain it is showing is realtime, delayed, or the last one taken before the market closed and when, so a holiday never reads like a live session.
The window
Open it from the Command Center’s VeilGEX tile, or as a tile on the Veil Desk.
Row 1 — the subject. The symbol (SPX or NDX), the ticker, Read as NQ / ES with the basis, the spot, the data chip, On chart ▾, Alerts ▾ and the Veil AI toggle.
Row 2 — the view, and only that view’s controls:
| View | Shows |
|---|---|
| Strikes | Exposure per strike as a field that scales to the book, with the flip, the walls and the ranked strikes tagged |
| Surface | Strikes across expiries — as a grid or a field — with an expiry picker, the greek (GEX, DEX, VEX, CHEX), the weighting, net or Δ since the open |
| Evolve | How the surface has moved through the day, grid or field, with a Diff mode and a day opener |
| History | Net GEX day by day over a range, with the DIX switch |
Tiles — one height, three lines each: NET GEX with the regime, FLIP, CALL WALL, PUT WALL, ABS γ, EXP MOVE, IV30 and VIX.
Right of the view — the gamma profile, the TODAY sidebar (today’s expiry on its own) and the vol term structure. The Veil AI dock opens beside it when toggled, primed with what is on screen.
Footer — symbol, spot, chain time, last check, and the keyboard map.
Read as NQ / ES
One switch re-expresses every strike, wall and flip point as NQ or ES instead of the index, using the time-matched basis between the future and the index — measured over the last regular-hours minutes, so the levels sit still across a timeframe change and read correctly overnight, when index cash is frozen. The index strike stays beside the translated one. The switch is disabled, with the reason, when no feed candle lands within ten minutes of the chain time.
Putting the levels on a chart
On chart ▾ puts the flip and the walls on an NQ or ES chart. The chart-side studies — Gamma Profile, Gamma Heatmap, GEX Levels, Option Profile and the rest — are described in Gamma studies; every one of them reads the options book the chart header names.
Alerts
Alerts ▾ arms an alert when price crosses a wall or the flip, or when the flip itself moves by more than a set number of index points. See Alerts.
On the desk
On the Veil Desk VeilGEX shows a compact face in a small tile — Strikes, Surface (grid or field), Evolve (grid or field) or History, your pick from the picker on the compact face — and the full dashboard when the tile has room. The bar folds its expiry and view into the symbol menu before anything is clipped.
One grammar
Positive gamma in blues, negative in purples, the flip in its own violet, spot in amber — the same three-step ramp, the same tag anatomy and the same regime pill in the window, on the chart studies, on the heatmap and on the ladder, so a level learned in one place reads the same in every other.