Welcome to Chartveil
What the platform is, what it is not, and how this manual is laid out.
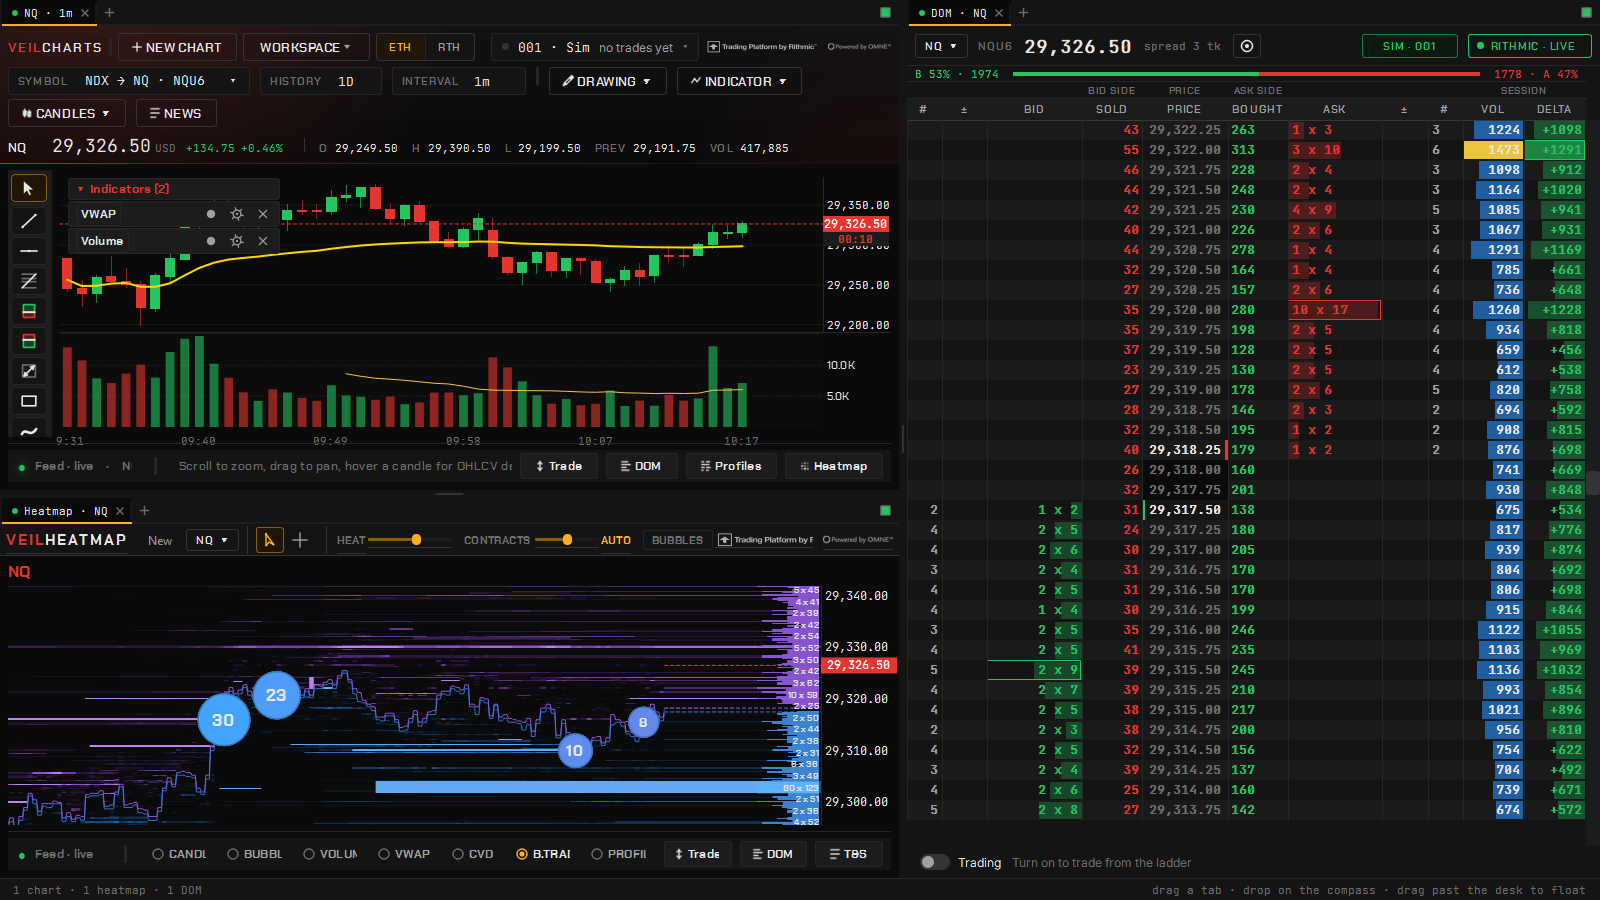
Chartveil is a desktop order-flow terminal for index futures. It puts a liquidity heatmap, a footprint, a depth ladder and volume and delta profiles on one shared tape, so every panel is describing the same instant in the book. You can trade from the chart and the ladder on your own prop-firm or broker account, rehearse on a built-in simulator, automate a strategy you wrote yourself, and keep an honest record of all of it in the journal.
It runs natively on Windows and connects to the market through the Rithmic data login your firm issues. Chartveil does not provide market data itself, is not a broker, holds no funds, and does not give advice. Every order sent from the platform is placed on your instruction, into your account, through your firm.
Who this manual is for
Anyone with a subscription and a Windows PC. It assumes you can read a candle chart and nothing more: the order-flow chapters explain the panels from first principles, and the glossary defines every term the platform uses.
If you only ever look at candles, that is fine. The charting, the drawing tools, the profiles and the standard indicators stand on their own; the heatmap and the ladder are there when you want them.
How the book is organized
| Part | What it covers |
|---|---|
| Start here | Requirements, installing, activating, connecting your feed, the Command Center. |
| The desk | Charts and bar types, tabs, the Veil Desk, workspaces, drawings, the global crosshair. |
| Order flow | The liquidity heatmap, Veil Print, the advanced DOM, Time & Sales, the profiles. |
| Studies | Adding and managing studies, the Veil studies, the standard indicators. |
| Dealer positioning | VeilGEX and the gamma studies on the chart. |
| Trading | Accounts and the simulator, the ticket, ladder trading, exits and sizing, the Risk Manager, alerts, the copier. |
| Automation | The Strategy Studio and the Auto Trader. |
| Record & assistant | The journal, News and the economic calendar, Veil AI. |
| Reference | Shortcuts, files and updates, troubleshooting, the glossary, account and billing. |
Read Start here in order; the rest can be read in any order. Every chapter stands alone and links where it depends on another.
Conventions
- Menu paths are written with arrows: right-click → Chart settings… → Sounds.
- Keys look like this: Ctrl+,.
- Names on screen — buttons, chips, tabs — are set in bold: press Connect Feed.
- Instruments are named by their exchange symbol: NQ, ES, YM, RTY, GC, SI and the micros MNQ, MES, MYM, M2K, MGC, SIL. Sizes are always in contracts.
- Times are ET (New York) unless the text says otherwise, because that is the clock the exchange keeps.
Callouts like this one carry something worth knowing before you go on. A Warning callout marks a rule that protects an account; read those twice.
What Chartveil will never do
It never places an order you did not ask for, never changes a setting behind your back, never sends your feed password anywhere, and never tells you which way to trade. Veil AI, the built-in assistant, explains and drafts; it cannot reach your orders, your Risk Manager or your account.
Where to get help
- The Help Center on the site answers the questions this manual gets asked most.
- Help → Report a problem… in the Command Center builds a snapshot of the version, feed, accounts and log and lets you see byte for byte what leaves before you send it. See Troubleshooting.
- Discord is where the quickest answers happen; the invite is on the contact page.