Veil Print — the footprint
Every executed trade sorted into the price it traded at and split by who was aggressive — eighteen ready-made looks, imbalance in two strengths, and numbers that are real fills.
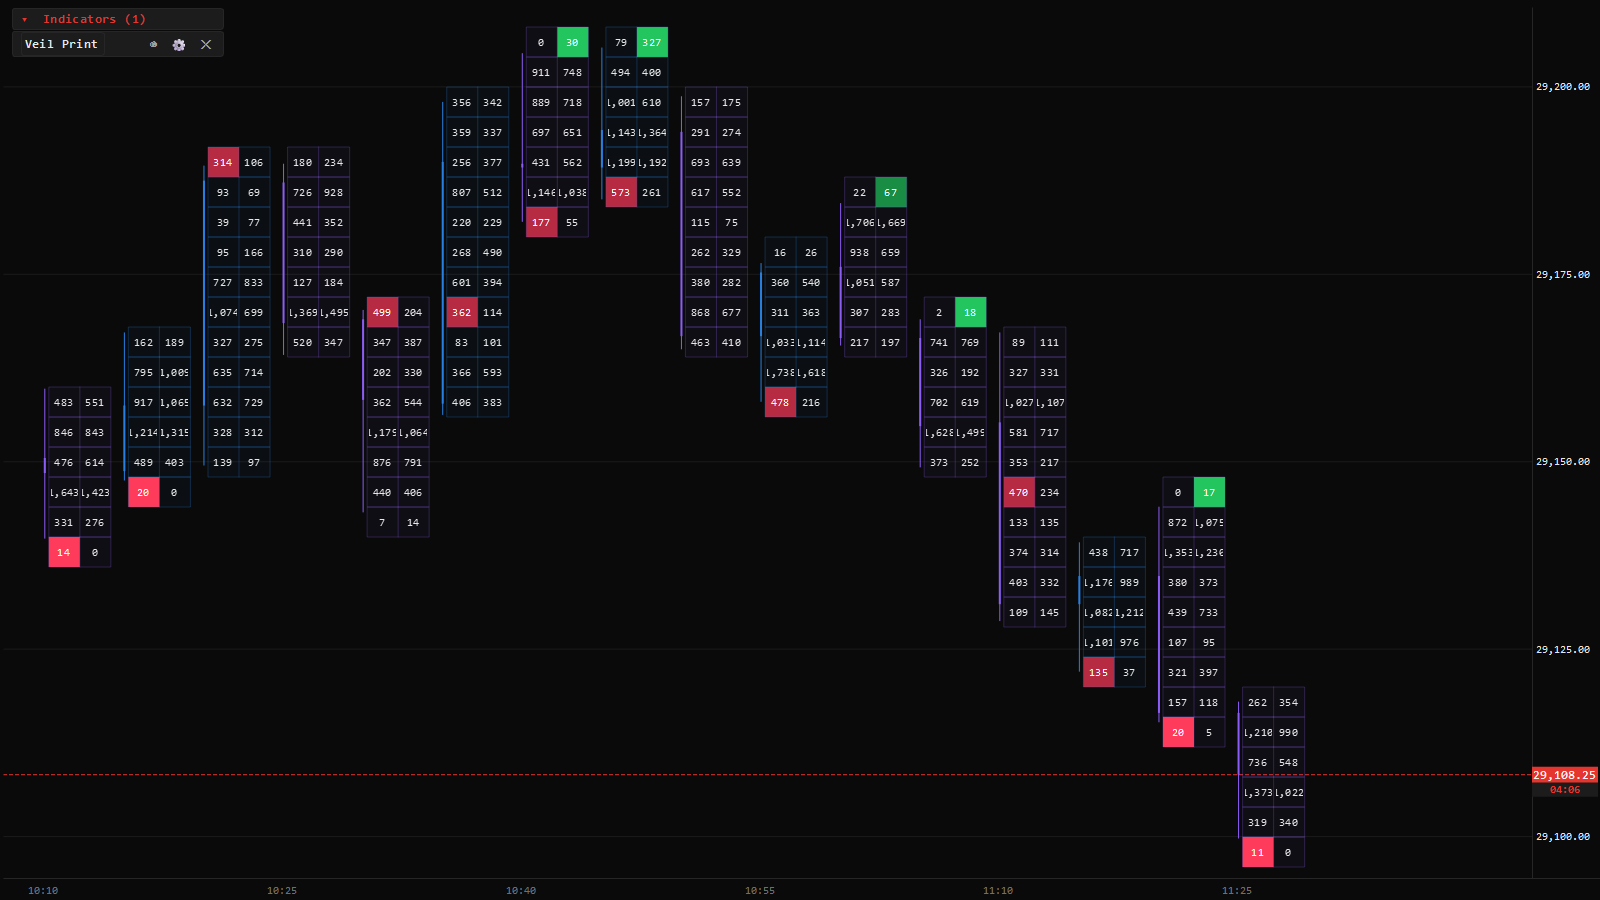
A footprint opens a bar up to show, at every price it traded, how much volume hit the bid and how much lifted the ask. It answers the question a candle cannot: not just where price went, but who was doing the work at each level on the way.
Veil Print is built from executed trades only. Snapshot and VWAP-update messages that some feeds reuse are discarded before anything is aggregated, so the bid × ask numbers in every cell are real fills, not feed artefacts. That is usually why its numbers differ from another platform’s: if a platform counts those messages as trades, its volume runs high and its delta drifts.
Adding it
Indicator ▾ → Volume & Order Flow → Veil Print. Choose a Type and a tick grouping and you are done. It works on every bar type — time, range, volume, trade, delta, renko — because they are all built from the same tick history. While tick history is still loading, the corner shows an ≈ bars badge naming why the study is approximating, and it clears on its own.
The eighteen types
Each type is a complete look, not a starting point. Pick the question you want each cell to answer:
| Type | Each cell shows |
|---|---|
| Ask×Bid Split | Volume that hit the bid on the left, lifted the ask on the right |
| Bid/Ask Ladder | The two sides as bars |
| Bid × Ask Profile | The split as a profile inside the bar |
| Bid × Volume × Ask | Bid, total, ask |
| Volume | Total volume at the price |
| Volume + Trades | Volume and the number of prints |
| Number of trades | Prints at the price |
| Average size | Volume per print |
| Delta | Ask volume minus bid volume |
| Delta + Total Volume | Delta beside the total |
| Delta % | Delta as a share of the cell’s volume |
| Delta Profile | Delta as a profile inside the bar |
| Cumulative Delta | Delta running through the bar |
| Imbalance | Only the cells that pass the imbalance test |
| Volume / Trades / Delta heatmap | Cells as heat rather than digits |
| Big Trades | Only prints at or above the big-print floor |
Imbalance
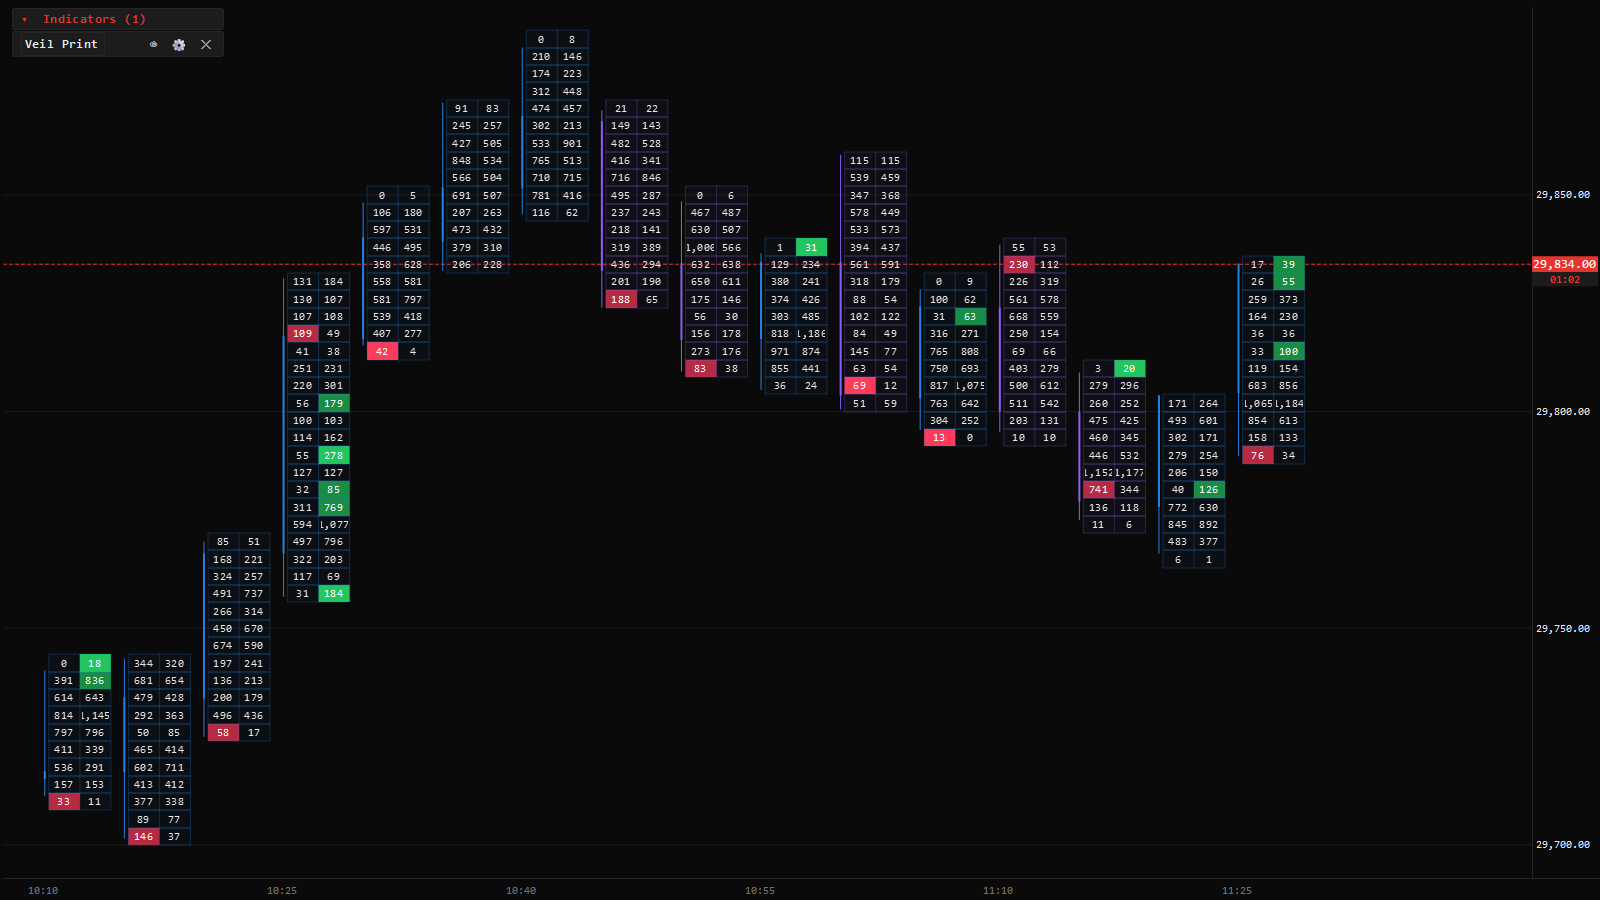
A half-cell lights up when one side is at least 200 % of the diagonally opposite cell — bid at this price against ask one tick below, and the reverse — and the raw difference clears a contract floor. The second test is why 2 | 0 stays plain while 15 | 0 lights up. A weak imbalance reads as bold coloured digits with a rail; a strong one fills the cell, so the two are never confused.
Both the ratio and the floor are settings. Widening the ratio makes almost every cell trip the test, at which point the highlight stops carrying information.
Reading a bar
- Every figure is set in a tabular mono face, bid and ask aligned to a hairline gutter.
- A quiet wash behind each row scales with its volume; the bar’s point of control is outlined.
- Cell shading follows the bar’s own direction, so the grid and the candle never disagree.
- The bar’s OHLC stays as a ghost candle behind the cells, so you never lose the price action while reading the volume.
- Zoom out and the cells step down to a compact tier and then to heat rather than going blank.
Settings worth knowing
| Setting | What it does |
|---|---|
| Tick grouping | Rows per cell — automatic by zoom, or a fixed number of ticks per row |
| Filter min / max | Ignore prints below or above a size |
| Executed trades only | On by default; the message filtering described above |
| Real bid/ask only | Hide bars whose sides had to be estimated from bar data |
| Proportion type | How a profile-type cell is scaled: bar-relative, chart-relative, automatic or manual |
| Draw the candle beside the block / hide the chart’s candles | Layout choices when the footprint is the chart |
| Font size mode, colours, borders, tint | The look — save it as a template once it is right |
Related
- Delta and cumulative delta across bars are their own studies: Veil Delta and CVD.
- Bar statistics — volume, delta, CVD and the extremes as tiles under the chart: Veil Bar Stats.
- The big-print floor is shared with the heatmap’s bubbles and Time & Sales.