Drawing tools
Lines, levels, Fibonacci, position tools, anchored VWAP, measurers, zones, and the Veil Profile drawn over any range.
The Drawing ▾ button in the chart header opens the picker. Pick a tool, click on the chart to place its points, and it is drawn. Star a tool in the picker and it is pinned to the left toolbar; a few standard favourites are pinned out of the box.
The tools
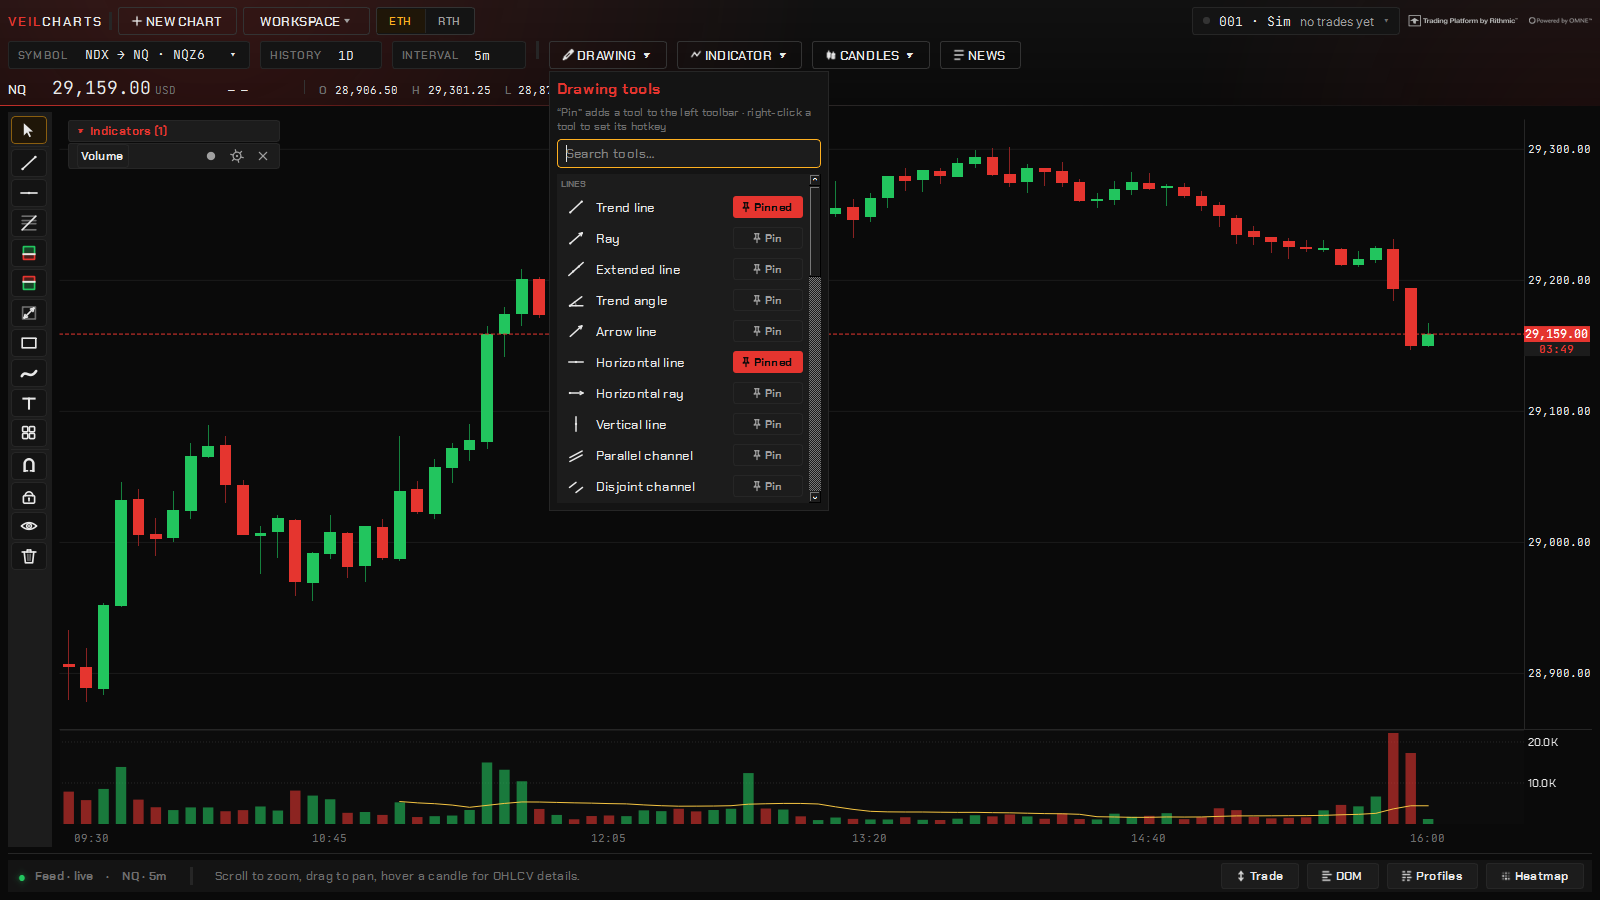
| Group | Tools |
|---|---|
| Lines | Trend line, ray, extended line, trend angle, arrow line, horizontal line, horizontal ray, vertical line, parallel channel, disjoint channel |
| Fibonacci | Fib retracement |
| Projection | Long position and short position (risk and reward as you drag), forecast, bars pattern, anchored VWAP, projection |
| Measurers | Date and price range, price range, date range |
| Volume-based | Veil Profile — a volume or delta profile over any range you choose, with its developing POC and value area if you want them |
| Zones | Rectangle, region (extends left and right), OB (extends right) |
| Brushes | Freehand brush |
| Arrows | Arrow, arrow marker, arrow mark up, arrow mark down |
| Text | Text |
The position tools read in ticks and dollars at the traded contract’s point value, so the reward-to-risk they show is the one the ticket will see.
Anchored VWAP
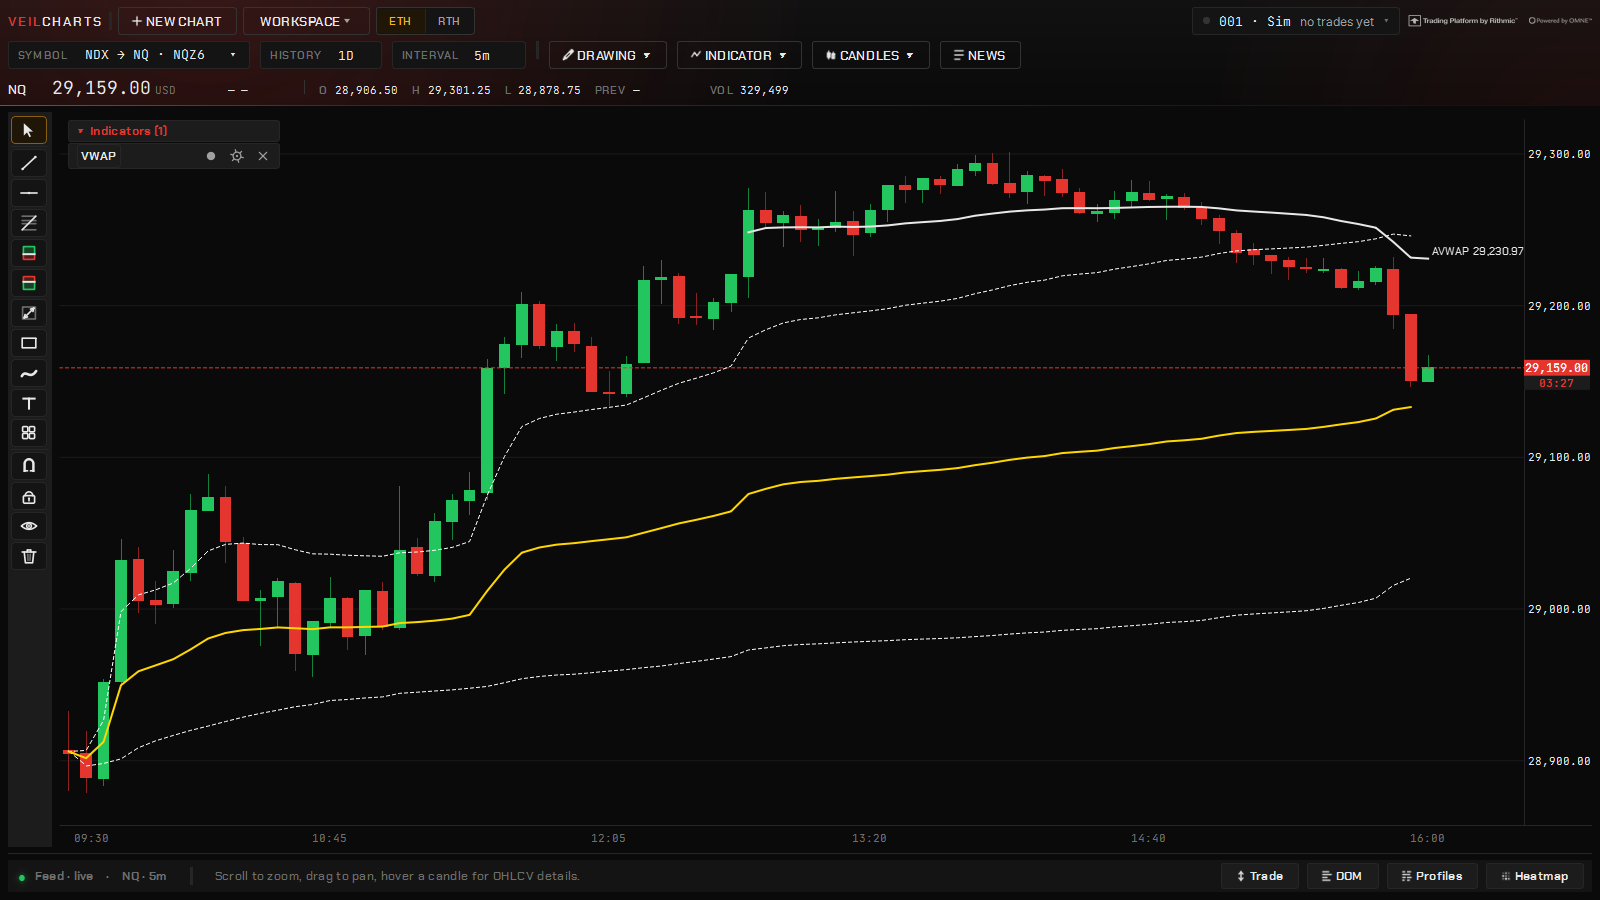
Click the bar to anchor from and the VWAP runs forward from there with its deviation bands. Reset every on its menu restarts it every 15 or 30 minutes, every hour or four, at the New York open (09:30 ET), the trading day (18:00 ET), the week or the month — all on the New York clock — or leaves it continuous. The tag on the chart names the reset.
Editing a drawing
- Select it by clicking; drag its points to reshape it or its body to move it.
- Right-click a drawing for its colour, width and style, to duplicate it, to lock it (no more accidental drags) or to hide it. More… opens the full property sheet.
- Delete or Backspace removes the selected drawing; the toolbar has lock all and delete all.
- Esc drops the tool and goes back to the cursor.
Drawings stop at the newest bar rather than drifting into empty space — except the projection tools, which are meant to reach forward.
A drawing as an alert
Right-click a line and switch on Alert when price crosses. The line itself becomes the alert, and it follows the line when you move it. See Alerts.
Where drawings live
Drawings are saved per chart and come back with the workspace. A shared workspace carries them too. The global crosshair is not a drawing — it is a mode — but a level drawn on one chart of a market is a level, and the alert it carries belongs to the market, not the window.