Advanced DOM
The market-by-order ladder — biggest × total at every level, prints landing on the price they hit, and trading from the price when you switch it on.
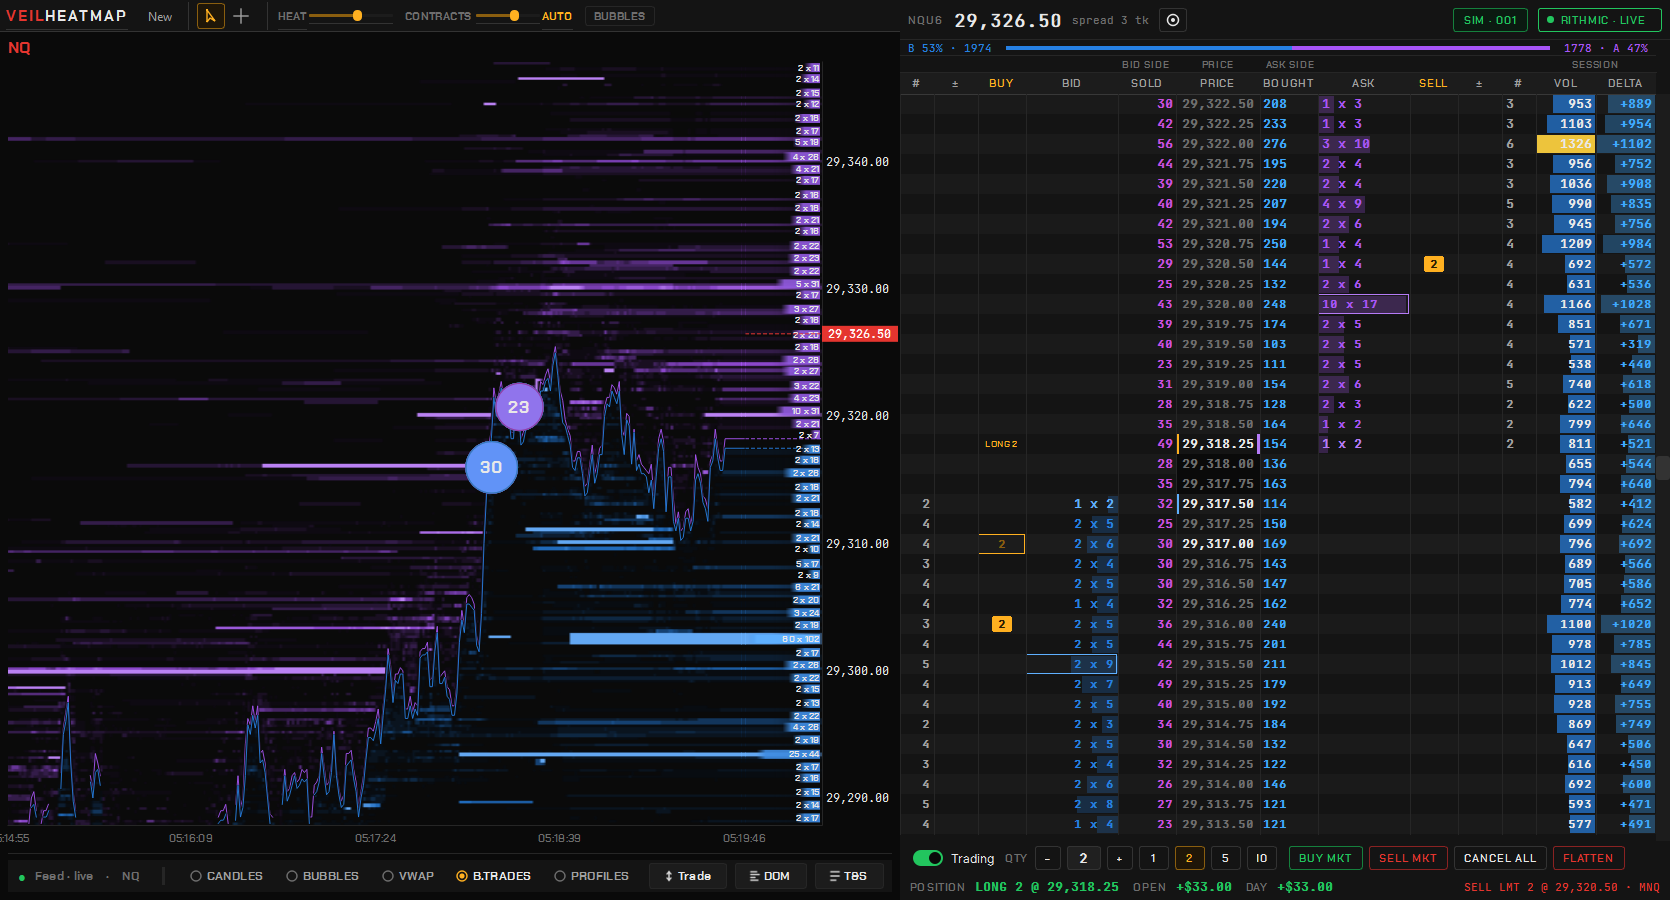
The Advanced DOM is a contiguous ladder, one row per tick, centered on the inside market. It prints every visible level as biggest × total, so you can tell one 200-contract order from forty 5-contract orders standing at the same price. It reads the same shared tape as the heatmap, so the two always describe the same instant.
It needs Level 2 on your feed login; without it the ladder says so.
Opening it
From the Command Center’s Advanced DOM tile, + Add on a Veil Desk, or Open beside ▸ on a docked chart. It opens with no instrument: pick one in the header. The header carries the instrument (click it to switch), the last price, the spread and the feed state; a thin bar above the columns shows the bid and ask sums across the visible book.
The columns
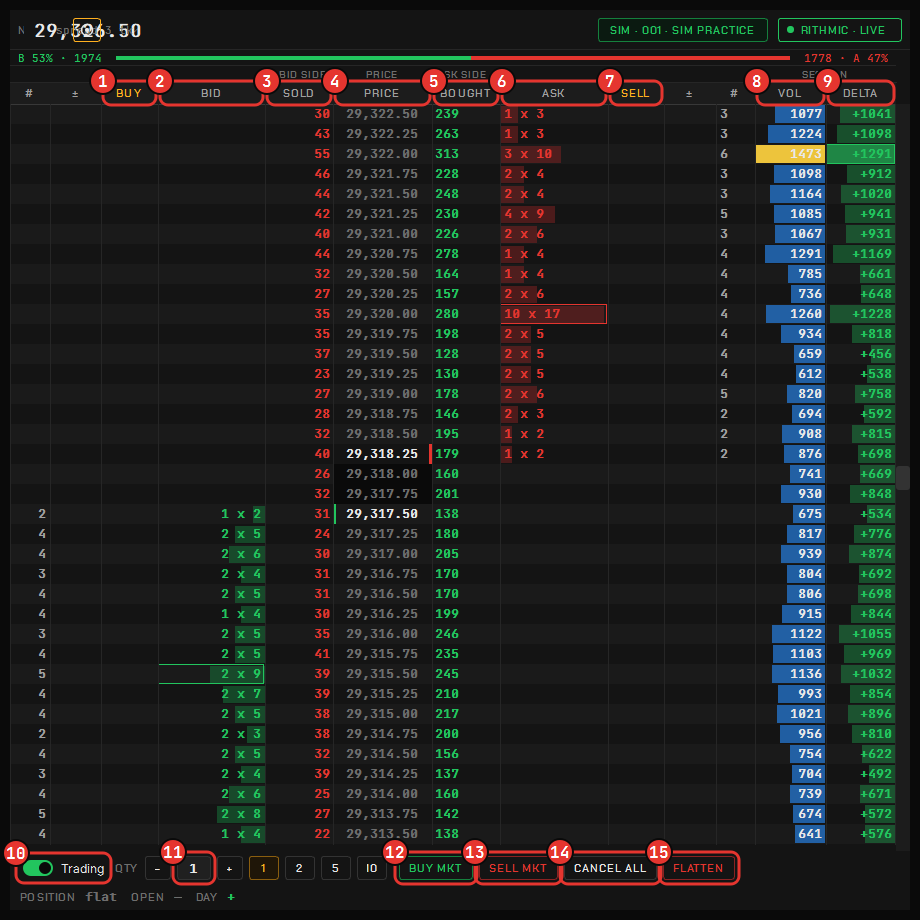
Read across a row, left to right:
| Column | Meaning |
|---|---|
| # | The number of resting orders at the level |
| ± | Size added (green) or pulled (red) there recently |
| BUY | Your own resting buys |
| BID | biggest × total — “10 × 13” means the biggest single order is 10 of the 13 contracts standing there |
| SOLD | Volume that hit the bid at that price |
| PRICE | The best bid and ask edged, the last trade tinted by its aggressor, your position marked |
| BOUGHT | Volume that lifted the ask at that price |
| ASK | biggest × total on the offer |
| SELL | Your own resting sells |
| ± and # | The ask side’s recent change and order count |
| VOL | The session profile per price, POC in gold, the value area in blue |
| DELTA | Buy minus sell volume per price |
Green is the buy side and red the sell side — the same pair as the candles and the ticket. Amber is always yours. The biggest level on each side is boxed, so the wall you care about is findable without reading every row. Right-click the column heads to choose which data columns show; a narrow tile folds the outer columns first into a chip.
When depth gets dense, rows drop by size rather than by position, so the levels that matter survive the cull.
Navigation
| To | Do |
|---|---|
| Scroll the ladder | Wheel — it detaches from the market and holds where you are |
| Recenter on the inside market | Home, a double-click, or the ⊙ button |
| Resize the rows | Ctrl+wheel |
A detached ladder holds an absolute price, so it does not creep with every quote.
Trading from the ladder

Trading is off every time the window opens. Turn on the Trading switch in the strip and the BUY and SELL columns wake up:
- Click a price in BUY to rest a buy there, in SELL to rest a sell — at or inside the market it rests as a limit, through the market as a stop.
- Your working orders sit in those columns as amber chips: drag a chip to move the order, click it to cancel.
- The strip has the quantity with presets (+ and − step it), BUY MKT and SELL MKT, CANCEL ALL and FLATTEN, then your position and the day’s P&L.
- Esc cancels the order being confirmed, otherwise cancels every working order. It never flattens.
A live account puts a red edge on the strip and asks for one confirmation per window before the first order leaves. A Risk Manager lockout paints a banner and refuses new entries while FLATTEN stays enabled — a lockout never traps the position it fired on.
Docked beside a chart, the ladder trades through that chart’s ticket — its account, its quantity and its live path — and the strip collapses to via ticket. The rules of the order ticket apply either way.
Chips in the header
Inside the last hour before a high-impact economic release a release chip appears in the header; see News & the calendar. The instrument chip switches the ladder in place, carrying its columns and size.