Managing studies
Adding, adjusting, hiding and removing studies; scaling their panes; and saving a setup as a template so every new chart starts where you want it.
Adding a study
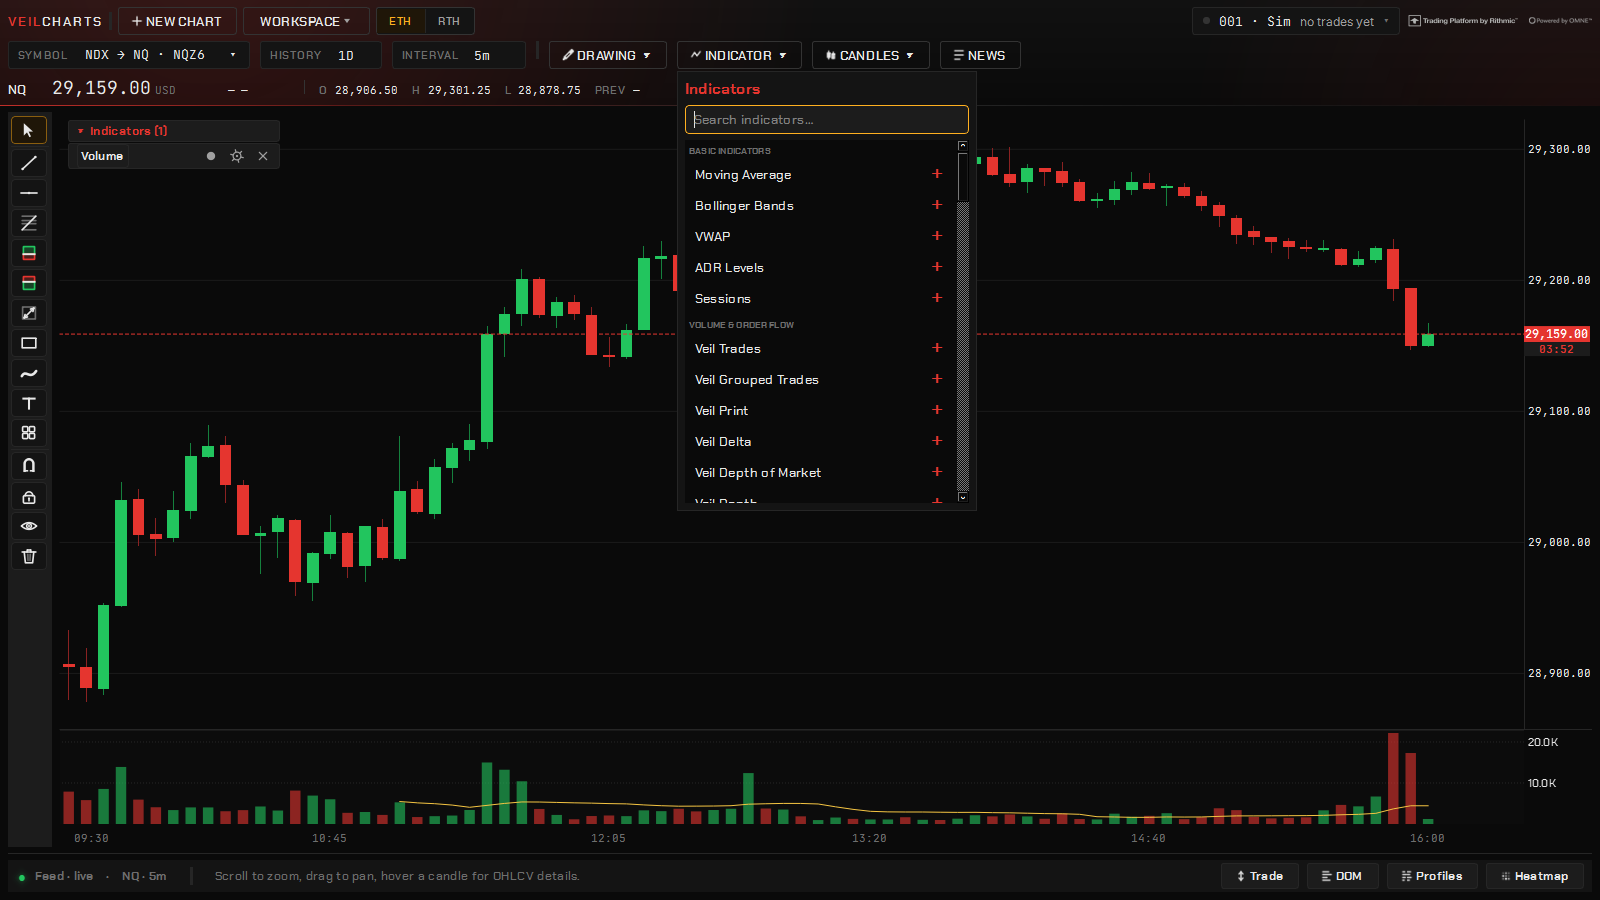
The Indicator ▾ button in the chart header opens the picker, grouped into:
- Basic Indicators — Moving Average, Bollinger Bands, VWAP, Sessions, ADR Levels, Structure.
- Volume & Order Flow — every Veil study: Veil Print, Veil Profiles, Veil Delta, Cumulative Volume Delta, Veil Trades, Veil Grouped Trades, Veil Bar Stats, Veil Candle Stats, Veil Depth, Veil Depth of Market, Veil Levels, Veil SMT Divergence, Veil Economic Events, Veil QQQ Levels, Veil RSI Candles.
- Gamma DP — the dealer-positioning studies. See Gamma studies.
- Oscillators — RSI, MACD, Stochastic, ATR, Volume.
- Custom — the indicators you wrote in the Strategy Studio.
Click a study and it is on the chart. Type in the picker’s search box to find one by name.
The legend
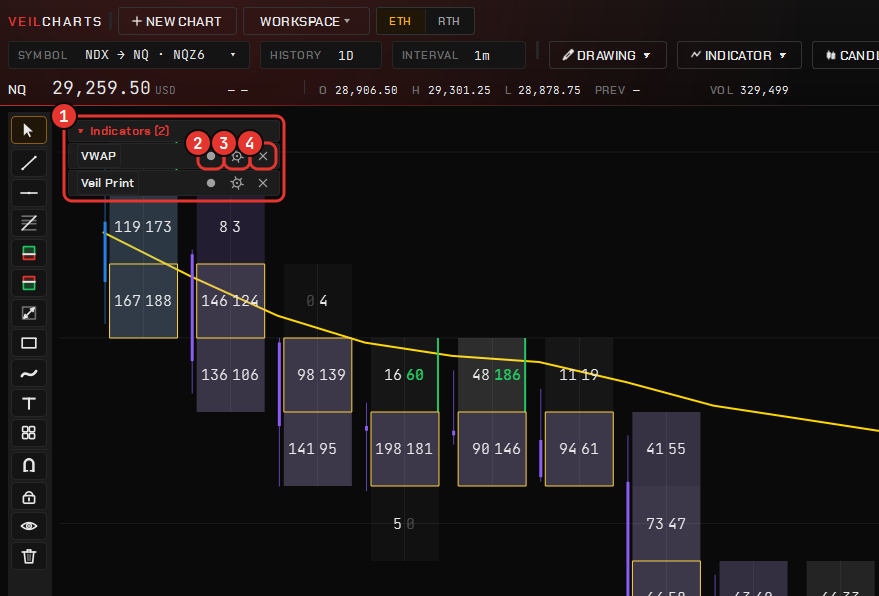
Every study you have added is listed in the legend at the top-left of the chart. That is where you:
- open its settings (click the study’s name, or the gear);
- hide it without removing it (the eye);
- remove it (the ×).
Right-click the chart → Studies on this chart lists the same things.
Panes
Studies that draw in their own pane — delta, CVD, the oscillators, Bar Stats — share the chart’s crosshair. Each pane is mouse-scaled:
| To | Do |
|---|---|
| Move the pane’s scale | Drag the pane’s body |
| Zoom the pane | Drag its own axis |
| Refit | Double-click its axis |
| Back to automatic pane sizing | Double-click the divider under the pane |
An auto-focus pill appears when you have wandered off the data and brings it back in one click. Delta and CVD scale three ways — automatic, symmetric around zero, or a manual range — from their settings.
Indicator templates
Once a study is set the way you like, save the settings as a named template from its settings dialog. Mark one template as the default and every new copy of that study starts from it, on every chart — so a footprint tuned for NQ does not have to be tuned again on the next window. Templates are saved in your config folder with the rest of your settings and travel with a copied config.
Cost
A study that reads ticks — Veil Print, the profiles, Bar Stats — costs more than one that reads bars. The knobs that matter when a chart feels heavy: the number of profiles shown, how many heatmap windows are open, and how far back a tick study reaches. A custom indicator that measures over 25 ms a bar is moved to a worker thread, paused after three failures and stopped at 512 MB, so a slow indicator of your own cannot take the platform with it.