Strategy Studio
Write your own indicators and strategies in sandboxed Python, validate them, put them on any chart, and backtest a strategy on that chart's own data.
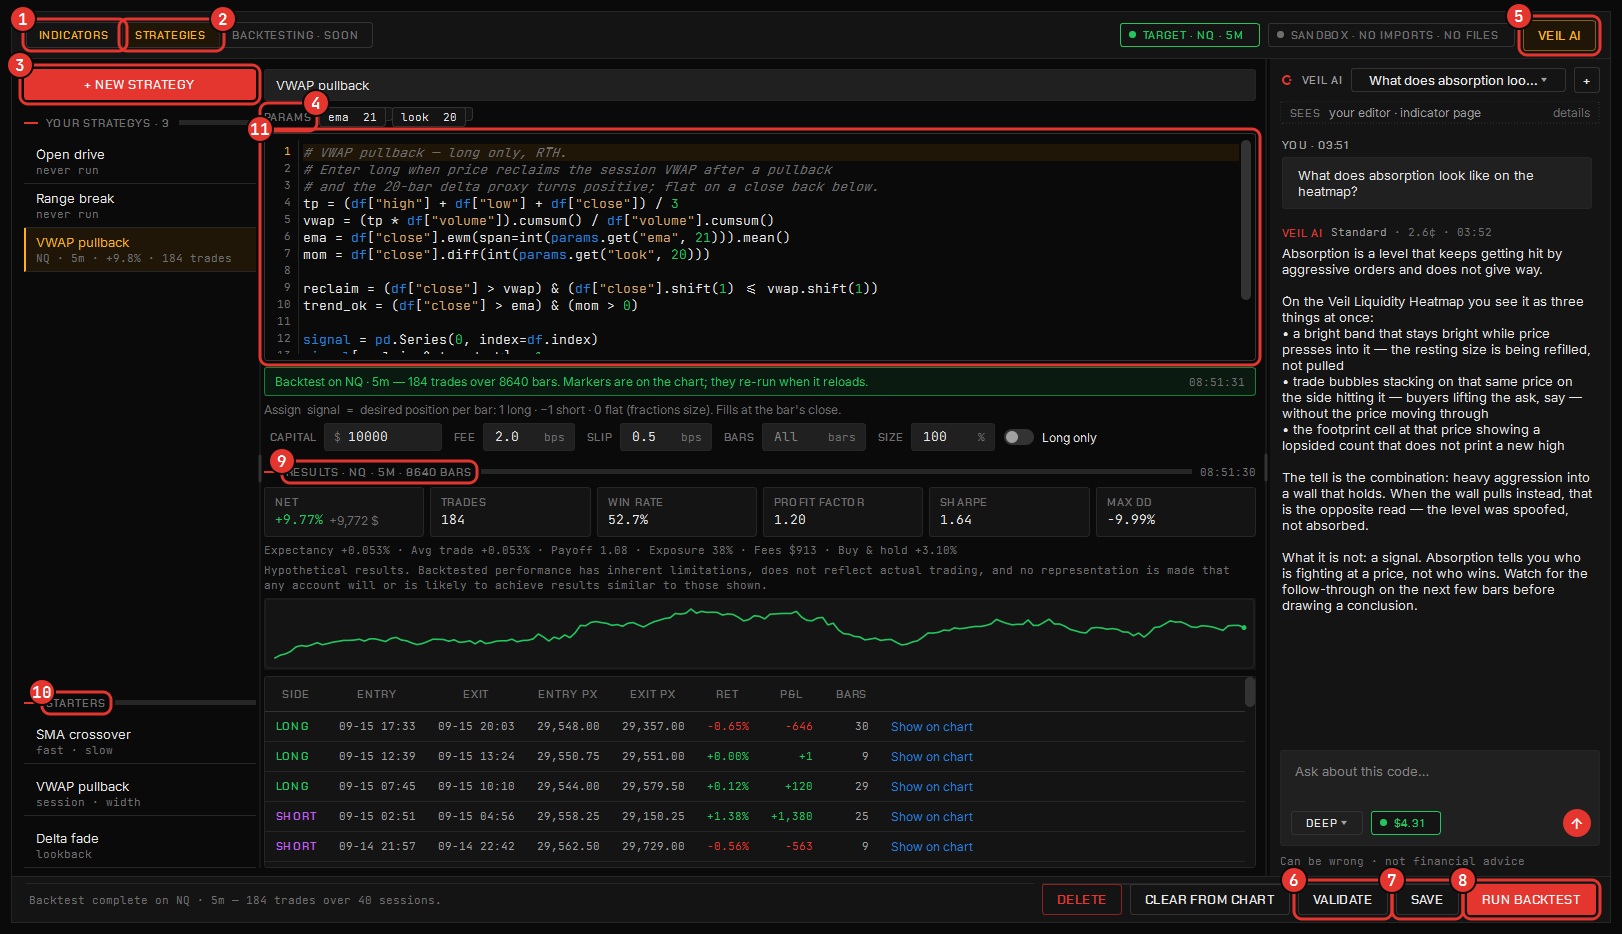
The Command Center’s Strategy Studio tile opens an editor for your own indicators and strategies. Code runs in a sandbox against the chart’s own candles: it gets the bars as a data frame with pandas and numpy, and nothing else — no imports, no files, no network, no reaching into the platform, and a runaway loop is stopped rather than allowed to freeze anything.
You need to write code, but not much — a working strategy is a few lines, the template is one, and Veil AI will draft one from a sentence. Chartveil does not supply strategies; it supplies the tooling to write, test and run your own.
The window
- The rail lists everything you have written with when it last ran and which charts it is on, beside starter templates to fork.
- The editor, with parameters beside the code so a variant is a number, not a copy.
- Veil AI docked beside the editor: describe the indicator or strategy and it drafts the code; one click inserts it. Nothing runs or saves until you do it.
- The deck under the editor: Validate, Save (Ctrl+S), Add to chart, and for a strategy the backtest results.
Drafts save themselves as you type and come back where you left them. Ctrl+N starts a new one; Ctrl+Enter runs the primary action.
Indicators
An indicator computes a line, a band or several from the candles, and whatever it returns is drawn on the chart under its own name, in the picker’s Custom section.
# Custom indicator — compute line(s) from the candles.
# Available: df (open/high/low/close/volume), pd, np, math, params (dict).
# Assign `result` = a pandas Series, a dict {label: Series}, or a list of Series.

length = int(params.get("length", 20))
result = df["close"].rolling(length).mean()
Custom indicators carry their own parameters, so a variant is a number you change on the chart rather than a second copy of the code.
Strategies
A strategy sets a desired position per bar — 1 long, -1 short, 0 flat — and the chart marks every entry and exit.
# Strategy — set `signal` (desired position per bar): 1 long, -1 short, 0 flat.
# Available: df (open/high/low/close/volume), pd, np, math, params (dict).
# This example goes long when a fast MA is above a slow MA (SMA crossover):

fast = df["close"].rolling(int(params.get("fast", 10))).mean()
slow = df["close"].rolling(int(params.get("slow", 30))).mean()
signal = (fast > slow).astype(int)
A strategy shown on a chart re-runs on new bars off the drawing thread.
Validate
Validate runs the code through the sandbox gate and over the open chart’s bars, reports any error with its line, and prints what the code costs per bar. Code that measures over 25 ms a bar is moved to a worker when it runs on a chart, paused after three failures and stopped at 512 MB, so an indicator can be wrong without taking the platform with it. Keep it cheap: vectorised pandas over the frame, not a Python loop over rows.
Backtest on the chart
For a strategy, run a backtest over whatever the open chart holds. The deck shows the equity curve, net, win rate, profit factor, Sharpe, drawdown, expectancy, exposure, fees and every trade listed. Change the data — another interval, another range — and the test re-runs. It reads the same bars the chart draws.
No backtest proves a strategy works. It can tell you an idea failed, which is most of the value; treat a good result as a reason for more scrutiny, not less. Deep-history testing — in-sample and out-of-sample splits, walk-forward, Monte Carlo on stored ticks — is the Backtesting tile, on the way.
From the Studio to the Auto Trader
The strategy that ran in the Studio is the strategy the Auto Trader deploys — on the simulator first if you want. Once deployed, its fills land in the journal tagged by strategy, so its live and simulated record accumulates in the same place as your own trades.