Trade Journal
Every fill journaled automatically — live and simulator — netted into round trips and put through the statistics a quant would run, with what the sample can show and what it cannot yet.
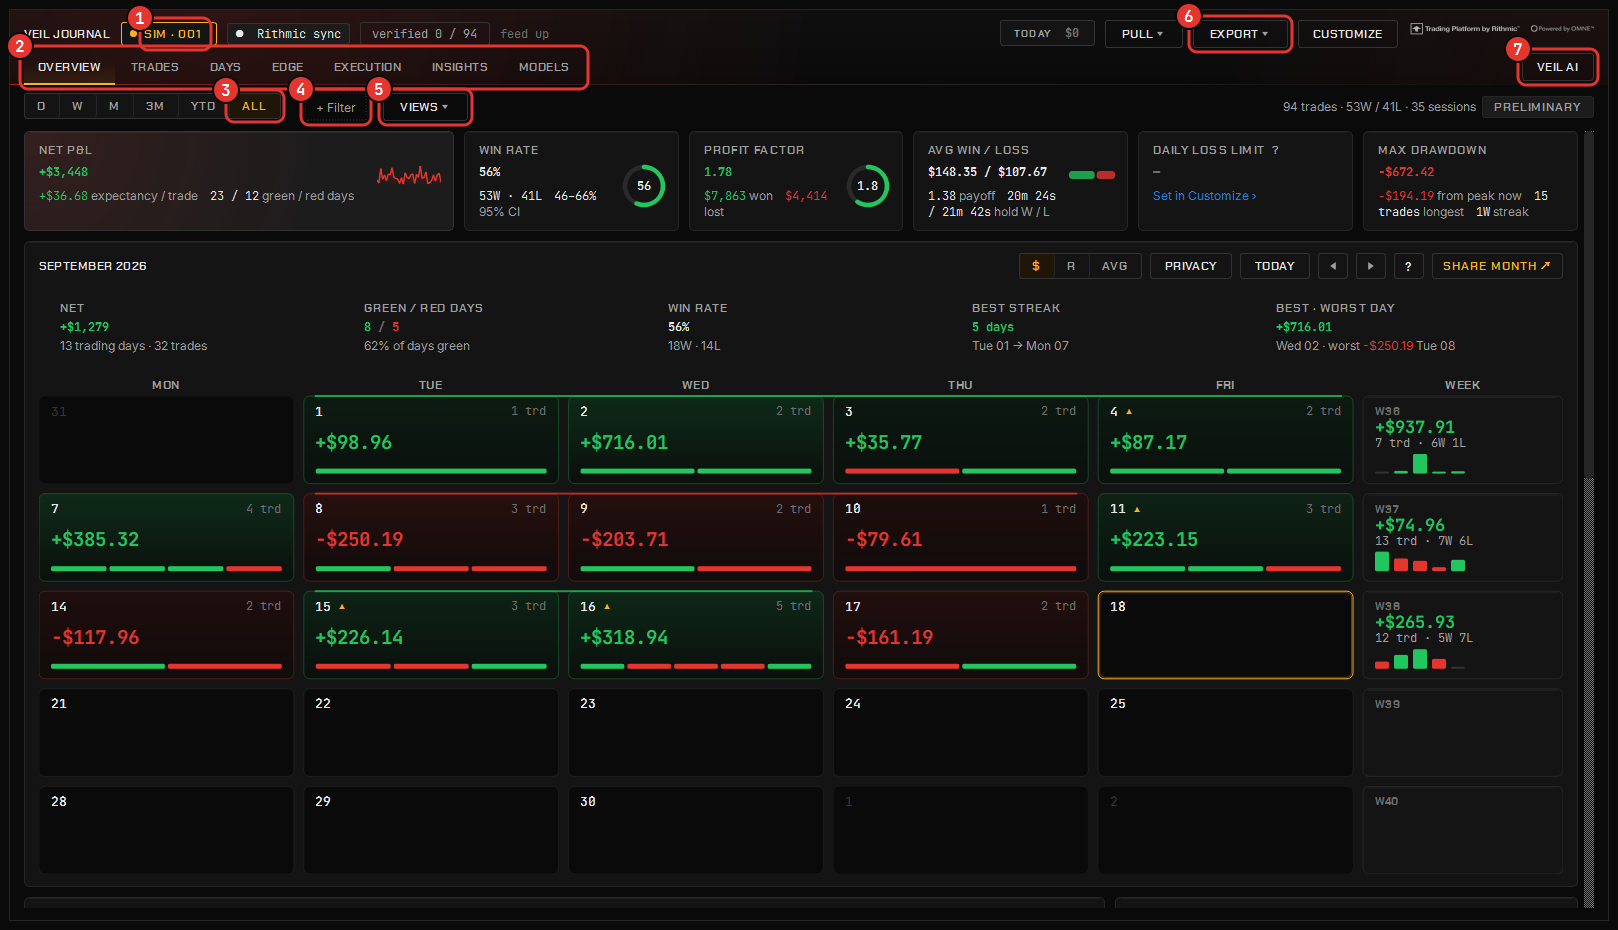
Nothing to fill in. Every fill on a live account or the simulator is captured on its own and netted into round trips — scale-ins averaged, flips split — each keeping the stop and target it was opened with, the exit reason, slippage against what you intended, and how far it went for and against you before it closed. Simulated trades are always labelled as simulated.
The journal opens from its tile in the Command Center, or as a tile on the Veil Desk beside the chart you are trading. It reads cleanly at any width, down to a narrow tile.
Where it lives
On your machine, in the config folder — your trading record does not leave your computer. Export gives it to you as CSV, JSON or Parquet whenever you want it somewhere else. Captured facts are sealed: prices, size, times and P&L come from the feed and cannot be edited. Your notes, tags, grades and plan stay yours.
Import CSV brings past trades in from another platform. It accepts common broker-export shapes, refuses duplicate re-imports, and keeps imported trades distinct from the fills the platform captured itself.
The tabs
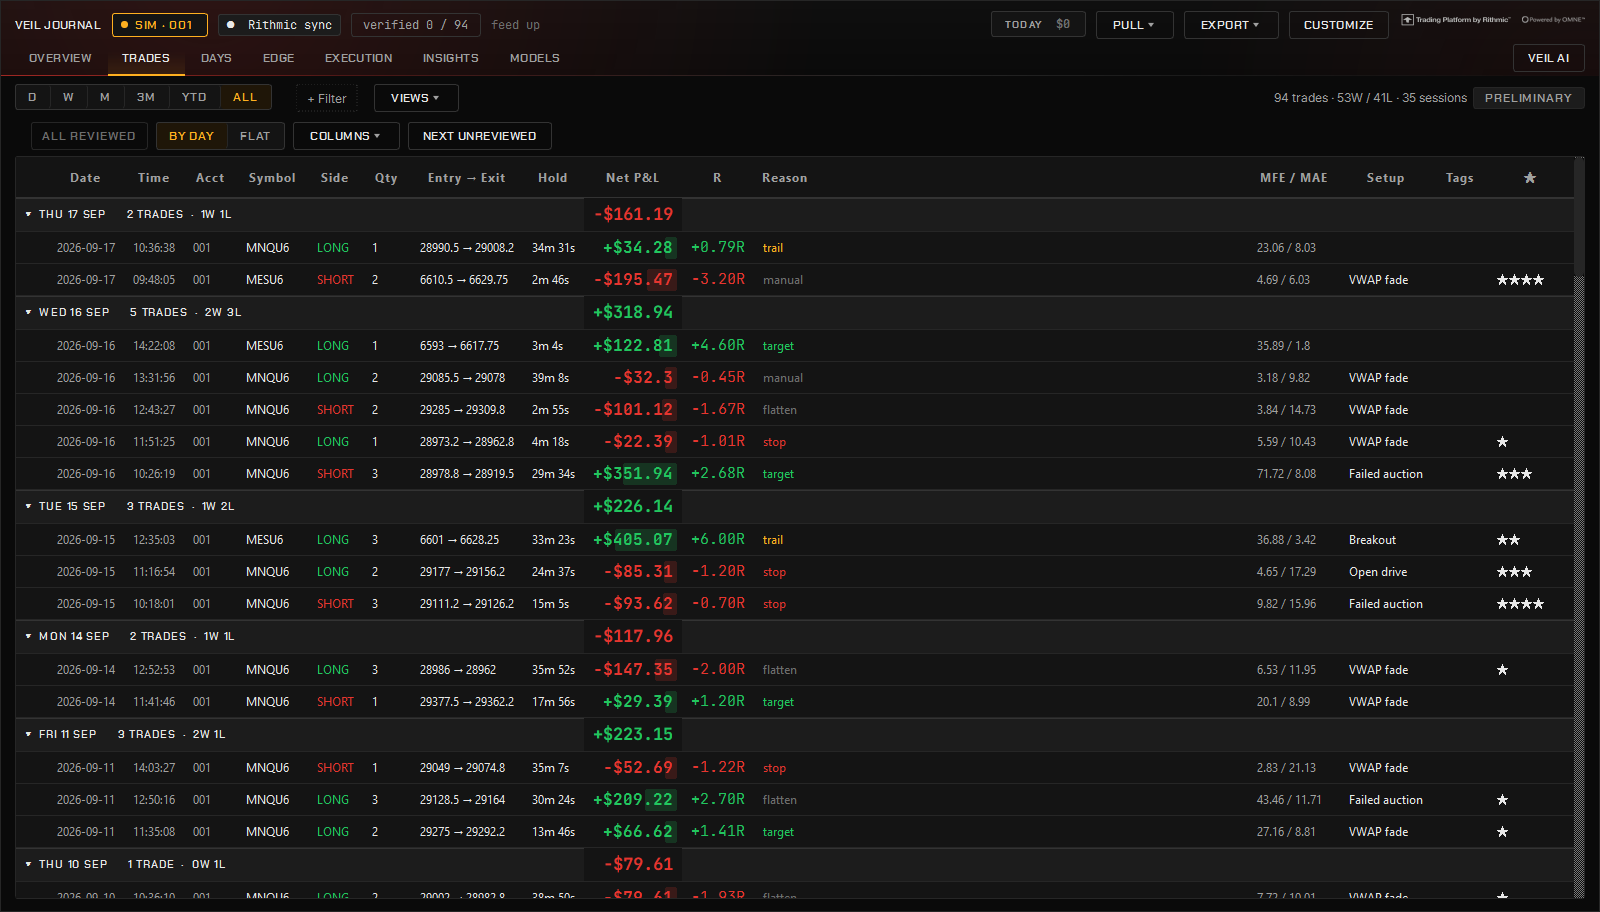
| Tab | What it holds |
|---|---|
| Overview | The report card: KPI cards, the Veil Score with its weakest part named, the equity curve with drawdown, the month calendar, daily bars and the top three findings |
| Trades | The sortable table — P&L, R, exit reason, plan — and the review panel |
| Edge | Is it real: confidence intervals on every headline number, cohort comparisons tested against the rest, Bayesian win-rate odds per setup, the rolling edge monitor and kill criteria |
| Execution | Entries and exits: MFE and MAE, exit efficiency, what was left on the table, the what-if rule engine, discipline and cost per mistake, hold time and slippage |
| Insights | The week against the prior four, ranked plain-English findings, and every breakdown — by hour, setup, session, side, exit reason |
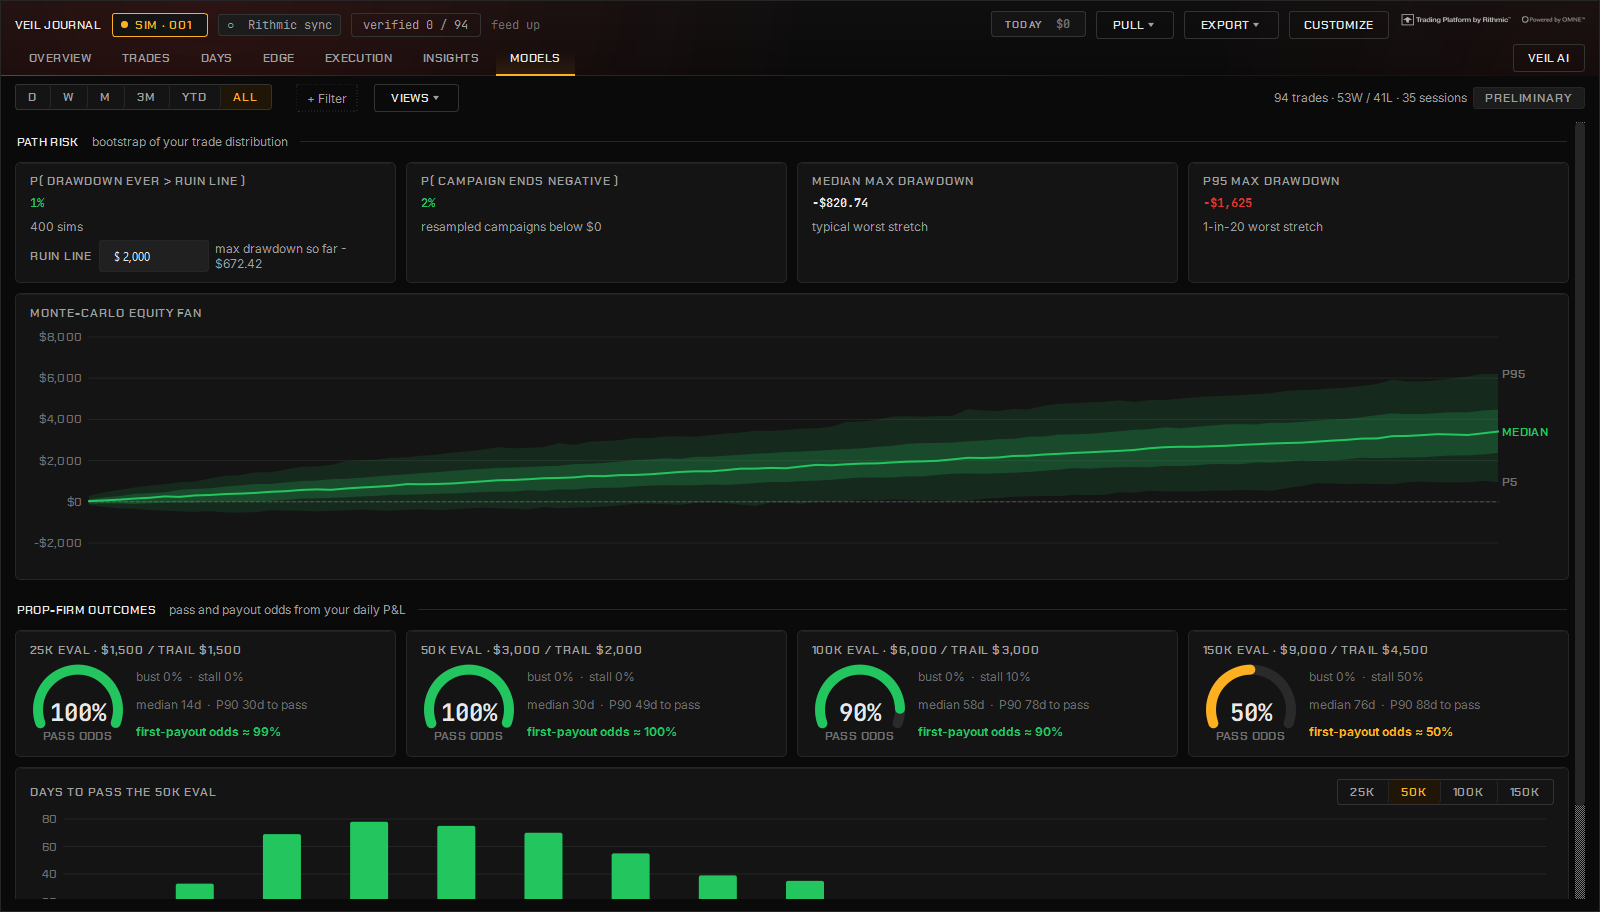
| Models | Monte Carlo projections and funded-account evaluation odds from your own daily results — pass rates, days to target, the odds of the drawdown that ends a run |
| Days | Notes that belong to a session rather than to one trade |
Badges on the tabs count what is still unreviewed.
Reviewing a trade
Open a trade and it is drawn on the bars it happened on — entry, stop, target and exit against the price that followed — beside the facts. ↑ and ↓ walk the day trade by trade, Enter opens the review, Ctrl+S saves it. The review panel takes the setup, tags, emotion, stars, whether the plan was followed, mistake chips, an execution grade, and a manual stop and target for R when no bracket was on the book.
Filters and views
Filter by date, instrument, session, setup or tag, and by account — pick several under Combine accounts… and every statistic, streak and calendar reads on the union, with one chip naming the set. Save a filter under a name and the view you keep coming back to is one click; views remember which accounts they were built on.
The calendar
Every day carries a strip of its trades in the order they closed, so a green day made of one lucky trade looks different from a green day made of six. Streaks run as rails across the days they lasted, each week has its own rail with a mini chart, and the month reads in dollars, in R or as the average per trade — switch at the top. The Privacy switch hides the figures for a screenshot; Share month renders the whole month as one image.
Small samples
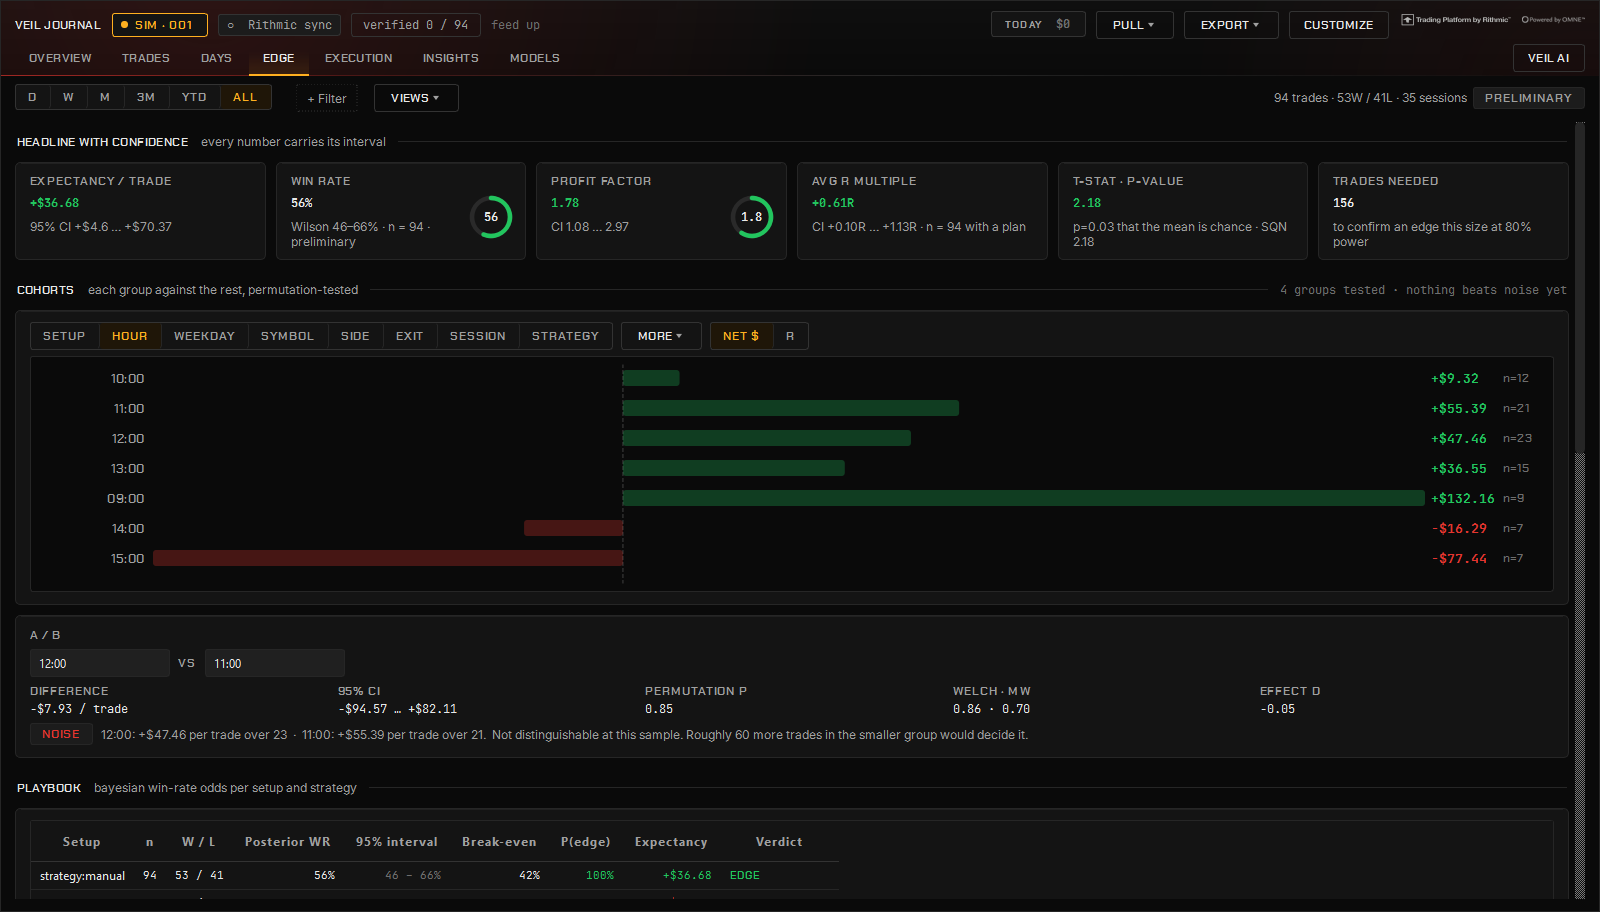
Every headline figure carries its interval, and when you split the record by hour, setup, session, side or exit reason each group is tested against the rest. A “bad hour” with eleven trades behind it is reported as a lead, with the number of trades it would take to confirm it — the journal does not round a small sample up into a verdict. It will tell you what the sample supports, not your edge.
Sharing
A share card renders one trade as an image or a short replay; Share month renders the calendar. Both carry the wordmark and are marked as simulated when the trade was; with the privacy switch on, the dollar figures are hidden. Nothing is uploaded — the card is a file on your machine that you post wherever you like.
Veil AI in the journal
Open the Veil AI dock inside the journal and it sees the statistics you have on screen — expectancy, sessions, setups, streaks, execution — and reads them like a coach: what the sample can show, and what it cannot yet. See Veil AI.