Time & Sales
Every print as it happens, or every aggressive order folded into one row — with a shared floor for what counts as big.
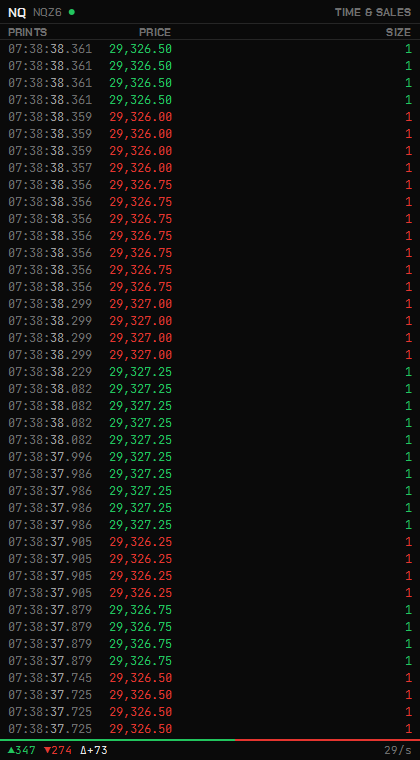
The tape lists every executed trade, newest at the top: time, price and size, the digits in the aggressor’s colour — green when the ask was lifted, red when the bid was hit — with a wash on any print at or above the big-print floor. That floor is the same one the heatmap’s bubbles and the Veil Trades study use, so the three agree about what counts as large. The footer keeps the last thirty seconds of buying, selling and their delta.
Opening it
It opens docked beside a chart or the heatmap, from Open beside ▸ on a docked chart, or as a tile on the Veil Desk from + Add.
Prints and Orders
Right-click for the menu.
- Prints is the raw tape, one row per execution.
- Orders folds the fills of one aggressive order into a single row with its total, how many prints it took and the last level it reached — which is what a sweep looks like from the other side. A 150-contract order that swept six levels reads as one 150-contract decision instead of six fragments.
A size filter on the same menu hides the churn.
Scrollback
Scroll up and the tape pauses where you are, with an amber chip counting the prints that have arrived since — click it to resume at the live edge.
Release chip
Inside the last hour before a high-impact economic release the tape’s header carries a release chip with the countdown; see News & the calendar.