Liquidity Heatmap
Resting orders at every price, painted four times a second — where walls build, where they pull, and who is getting hit on the way.
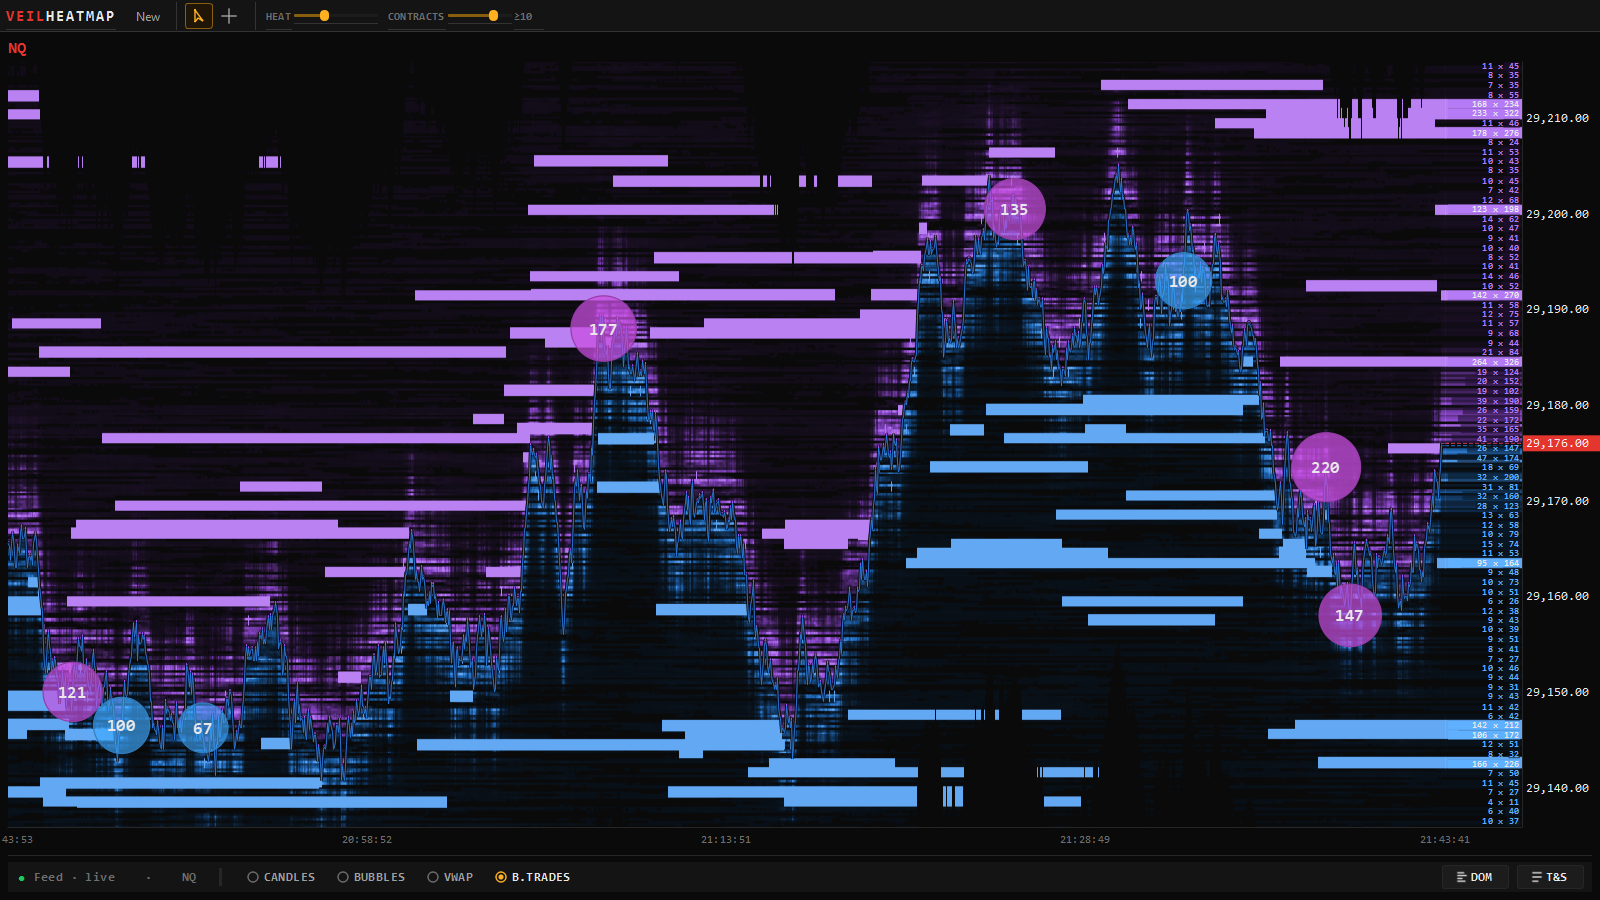
The heatmap draws the book over time. Each row is one tick of price; each column is one snapshot of the book, newest on the right; brightness is resting size. A level that holds size draws a horizontal streak; a cancel ends that streak the instant it happens, which is what makes a pull visible. A volume profile shows where trades happened; a heatmap shows where orders are waiting. The two disagree constantly, and the disagreement is usually the information.
It needs Level 2 on your feed login. Without it the map is empty and the instrument menu says no depth beside the market — see Requirements.
Opening it
From the Command Center’s Liquidity heatmap tile, from + Add on a Veil Desk, or from Open beside ▸ on a docked chart. The window opens with no instrument: pick one on the NQ ▾ chip in its strip. The map paints as soon as the depth feed is up; 90 minutes of recorded depth are kept on disk, so a restart does not start from a blank map.
Reading the map
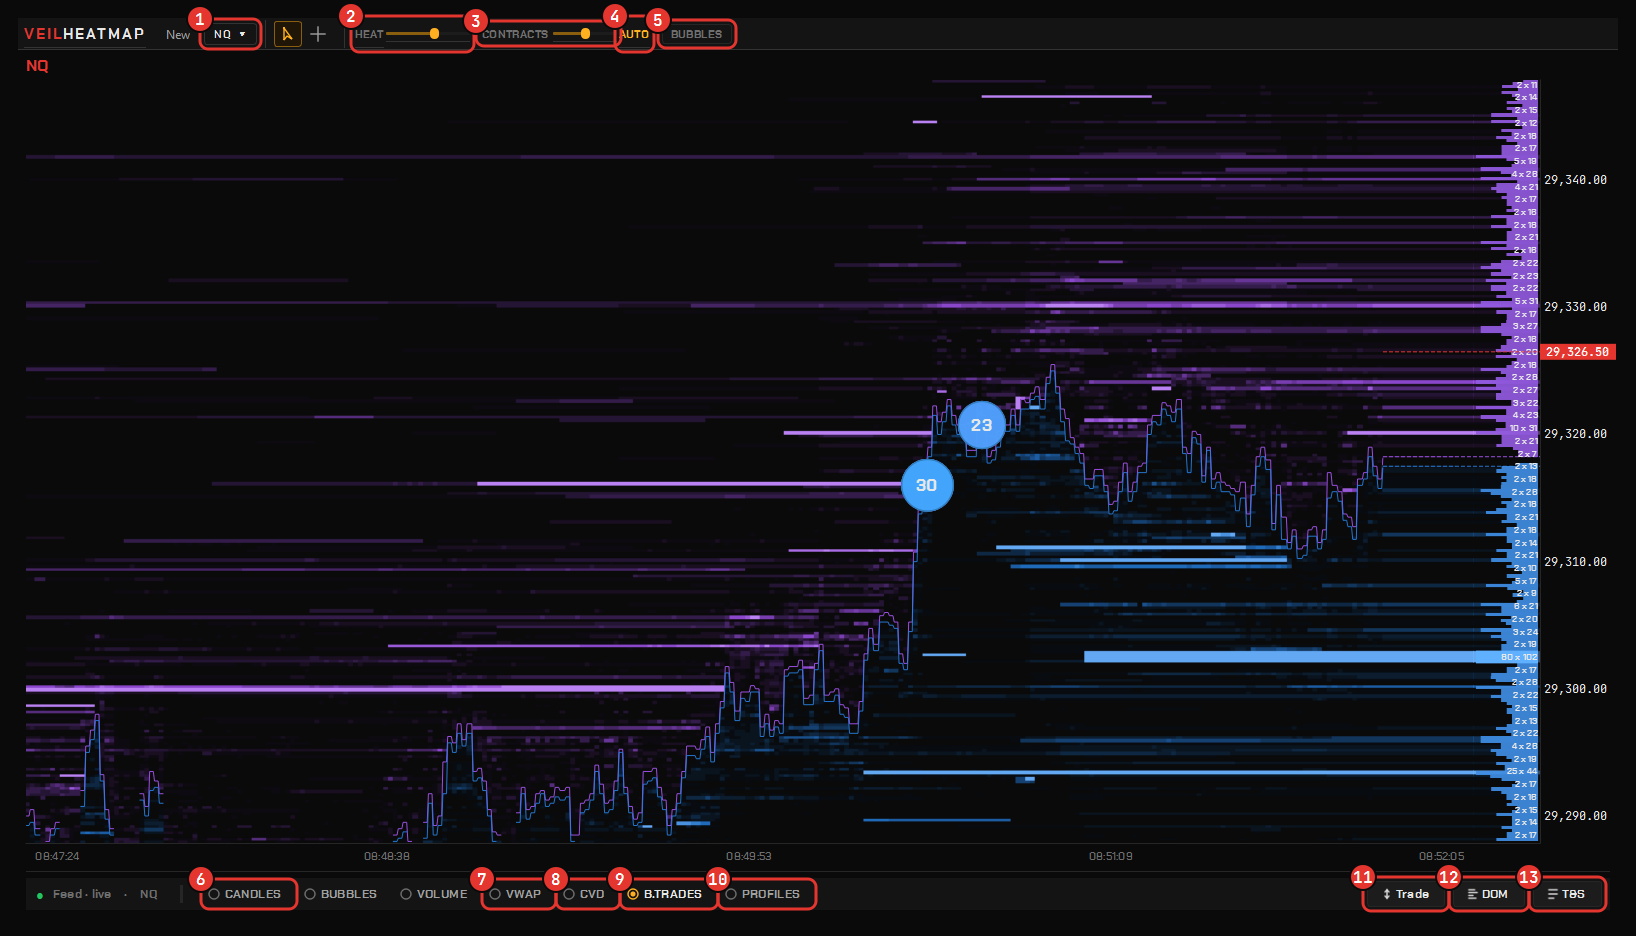
- Streaks are resting size holding at a price. Bright and long is a wall that has stood; a streak that ends abruptly as price arrives was pulled — shown to attract price, never meant to be filled. Watching that happen is most of the reason to look at resting liquidity rather than a candle.
- The colour range adapts to the book in front of you, so one freak wall cannot flatten the map and thin liquidity still glows faintly instead of being deleted.
- The size floor holds the 1–10 contract churn that fills the book all day below the visible range, so the colour ramp is spent on size that could stop price. Raise it on a busy book, lower it on a thin one.
- Bid and ask lines are drawn from every price change, not a once-a-second sample, and the recorded history survives a restart so they run unbroken across sessions.
- One band per tick. Nothing is bucketed into price groups to save pixels.
The ladder column
At the right edge every level prints biggest × total — the largest single resting order at that price, then the level’s whole book — on a ladder of one bar per price level. One 200-contract order and forty 5-contract orders both total 200 and behave nothing alike; the split is the difference. The heaviest levels are lit. It is the same book as the Advanced DOM, read from the same tape.
Big-trade bubbles

Aggressive prints bubble onto the side they hit, sized by contract count, and follow that line as the map scrolls. Click a bubble for its settings: mode (prints or orders), filters, sizing, colours and grouping, saveable as a template. The size floor for what counts as big is shared with Time & Sales and the Veil Trades study, so the three agree.
Bands under the map
- Volume — traded volume per column.
- CVD — cumulative volume delta as a band of its own with its own scale, a live value chip in the line’s colour and a zero rule, reset at the 18:00 ET session, the New York open, or rolling. It reads as delta, never as a second price track across the heat.
- Candles — the chart’s bars over the map, if you want them.
- The time axis sits under the bands.
Switch each on or off from the right-click menu’s Show section.
The Profiles dock
A profile column at the edge of the window that runs its full height — through the volume and delta bands to the time axis, on the map’s own price scale. High- and low-volume nodes are marked on it and can be extended across the map as levels. Each column can show volume, delta, bid/ask or the TPO letters; see Profiles.
VWAP and levels
The same engine draws VWAP and its bands on the heatmap and on the chart, so the two windows never disagree about where it is. GEX walls and the flip read here in the same grammar as everywhere else. See Gamma studies.
Switching the market
Click the NQ ▾ chip on the strip, or right-click → Instrument. The window moves to the market you pick with its zoom, look and docked panels carried over — no second window to arrange. Open in a new window instead is on the same menu when you want both, and Duplicate this window copies the one you have.
Navigation
| To | Do |
|---|---|
| Zoom time | Wheel over the map, or Ctrl+wheel |
| Zoom price around the cursor | Wheel over the price scale |
| Pan price | Shift+wheel |
| Pan both axes | Drag |
| Snap back to the live edge | Double-click, or Esc |
| Cancel an order or drag in progress | Esc |
When you scroll away from the live edge the map holds where you are; Esc or a double-click resumes.
Trading on the heatmap
Orders placed on the chart or the ladder for this instrument draw on the map at their price. Right-click a working order to cancel it, Cancel all working orders pulls everything, and Flatten closes the position. The same rules as everywhere else apply — see The order ticket.
Appearance
Right-click → Appearance… holds the ramp, the size floor, the bubble look and the footer. The map paints the same ground and the same candle colours as Chart settings → Appearance, so a colour change on the chart changes the heatmap too.