User Manual · version 0.9.13
Every panel, every rule, one book.
How to install Chartveil, connect your feed, read the heatmap, the footprint and the ladder, trade from the chart, and keep an honest record of it. Written for the current Windows build; the changelog says what each release changed.
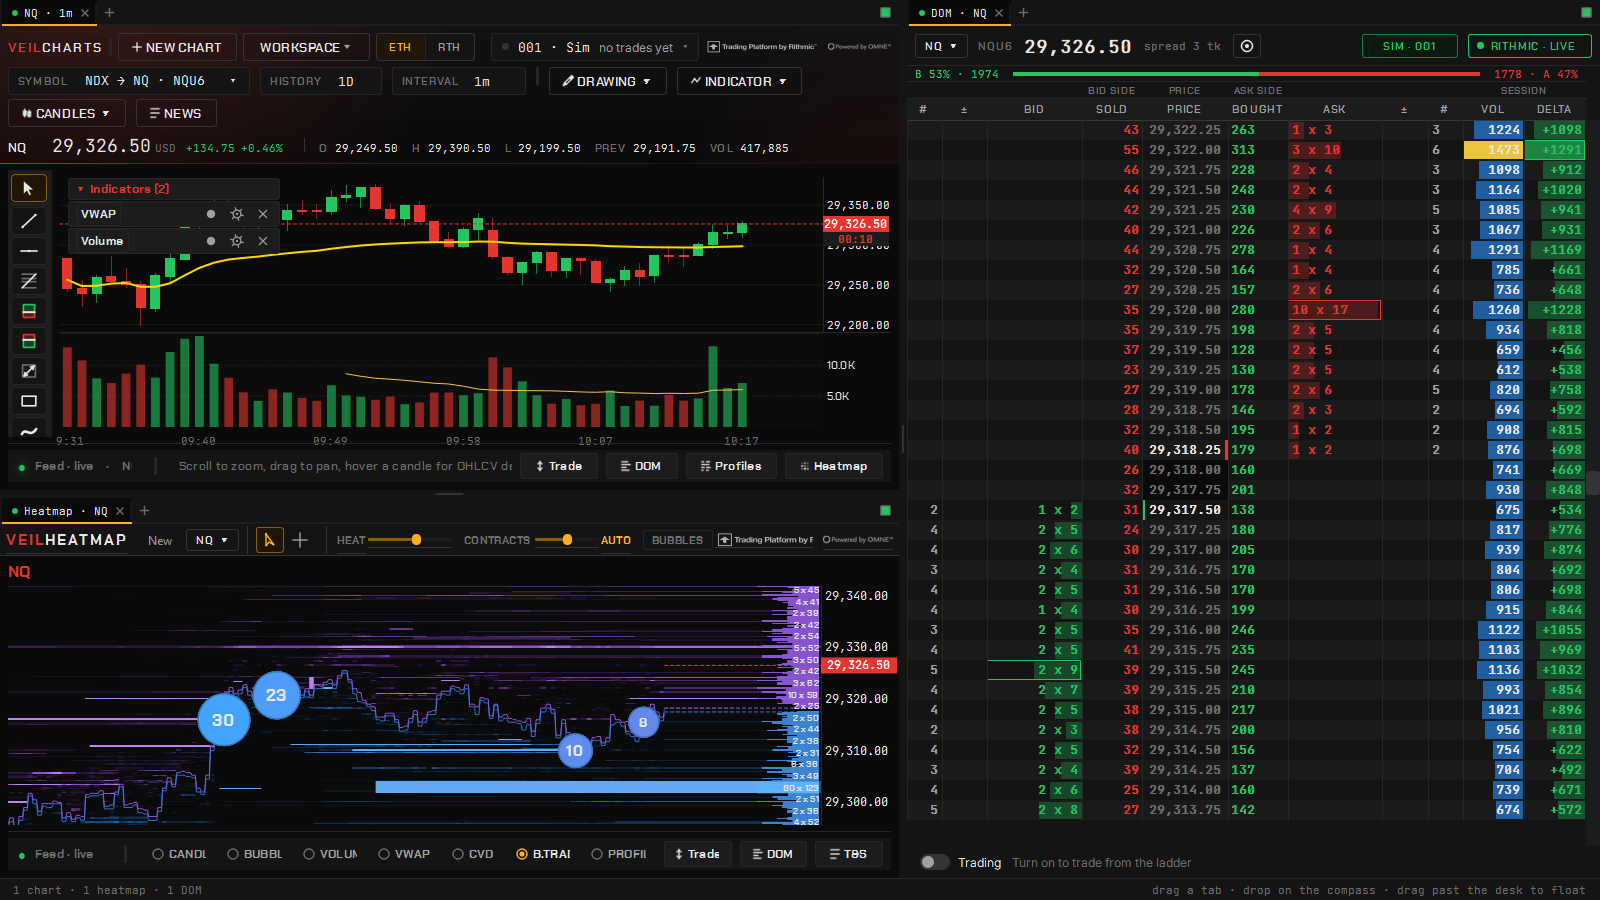
Start here
- Welcome to ChartveilWhat the platform is, what it is not, and how this manual is laid out.
- Requirements & installationWhat you need before the first launch, and how the installer behaves.
- First runActivate the build, connect your feed, open one chart, and set two things up before you ever trade.
- The Command CenterThe launch window — every tool opens from here, the feed and the Risk Manager report here, and closing it exits the platform.
The desk
- ChartsThe chart window — bar types built from ticks, the header, moving around, colours and appearance, and what to do when a chart looks wrong.
- Tabs, windows & the Veil DeskThree ways to arrange the platform — several charts in one window, windows across monitors, or everything docked into one desk.
- WorkspacesSave whole desks under a name, switch between them, and share one with another trader with nothing private inside.
- Drawing toolsLines, levels, Fibonacci, position tools, anchored VWAP, measurers, zones, and the Veil Profile drawn over any range.
- The global crosshairOne crosshair that marks the same price and moment in every window, and a note on replay.
Order flow
- Liquidity HeatmapResting orders at every price, painted four times a second — where walls build, where they pull, and who is getting hit on the way.
- Veil Print — the footprintEvery executed trade sorted into the price it traded at and split by who was aggressive — eighteen ready-made looks, imbalance in two strengths, and numbers that are real fills.
- Advanced DOMThe market-by-order ladder — biggest × total at every level, prints landing on the price they hit, and trading from the price when you switch it on.
- Time & SalesEvery print as it happens, or every aggressive order folded into one row — with a shared floor for what counts as big.
- Profiles — volume, delta, TPOWhere the volume happened and who was aggressive there — session and composite profiles, the TPO letters, the full-height Profiles dock, and bar statistics as tiles.
Studies
- Managing studiesAdding, adjusting, hiding and removing studies; scaling their panes; and saving a setup as a template so every new chart starts where you want it.
- The Veil studiesThe order-flow and structure studies that are Chartveil's own — delta, CVD, big prints, sessions, VWAP, the book on the chart, levels, divergence and the calendar.
- Standard indicatorsMoving averages, Bollinger Bands, VWAP, RSI, MACD, Stochastic, ATR and Volume — the standards, done properly.
Dealer positioning
- VeilGEXDealer gamma exposure by strike on SPX and NDX — the flip, the walls, the expected move — read in the contract you trade.
- Gamma studies on the chartThe picker's Gamma DP section — exposure as terrain, as a heatmap, as a ledger of levels, and the options book itself, all on the chart you are already reading.
Trading
- Accounts & the simulatorBroker accounts read back from your firm; simulated accounts that carry a funded program's rule book so you can rehearse the exact account you plan to trade.
- The order ticket & chart tradingMarket, limit, stop and stop-limit orders priced by clicking the chart; your position on the bars with draggable stop and target; chart one contract and trade its sibling.
- Exits, sizing & soundsA saved exit plan that every entry carries, sizing by what the trade may lose, and hearing what your orders did.
- The Risk ManagerOne rule book over every account — daily loss and profit limits, session blocks, blocked instruments and a cooldown — that cannot be loosened once it starts hurting.
- AlertsAn alert belongs to the market, not the window — a price, a drawn line, a level that moves, a study, a strategy signal, a big print or a wall — delivered on the chart, spoken, as a Windows notification and a taskbar flash.
- Trade CopierTrade one account and the others you own follow — in copy groups, sized per follower, with exits that fit what each follower actually holds and a kill switch you have to hold.
Automation
- Strategy StudioWrite your own indicators and strategies in sandboxed Python, validate them, put them on any chart, and backtest a strategy on that chart's own data.
- Auto TraderDeploy a Studio strategy to trade its own signals — one strategy, one market, one timeframe, one contract count — with brackets, lockouts, a wind-down and a kill switch.
Record & assistant
- Trade JournalEvery fill journaled automatically — live and simulator — netted into round trips and put through the statistics a quant would run, with what the sample can show and what it cannot yet.
- News & the economic calendarToday, Week and Headlines on Chartveil's own economic calendar, a countdown to the next high-impact release, the 15-minute reaction beside every release that has printed, and spoken warnings if you want them.
- Veil AIAn assistant inside the terminal that explains order flow and the platform, reads your journal, interprets the VeilGEX map and drafts Studio code. It explains and drafts; it does not trade and does not advise.
Reference
- Keyboard & mouseMost of the platform is driven by the mouse; the few keys that matter are the same in every window.
- Files, updates & seatsWhere the platform keeps things, how updates arrive, and how the seat on your plan moves between machines.
- TroubleshootingWhen something looks wrong — the feed, the licence, an empty panel, a slow desk — and how to report a bug usefully.
- GlossaryThe terms the panels use.
- Account & billingSigning in, the dashboard, seats, Veil AI balance, cancelling, and what the subscription includes.