Profiles — volume, delta, TPO
Where the volume happened and who was aggressive there — session and composite profiles, the TPO letters, the full-height Profiles dock, and bar statistics as tiles.
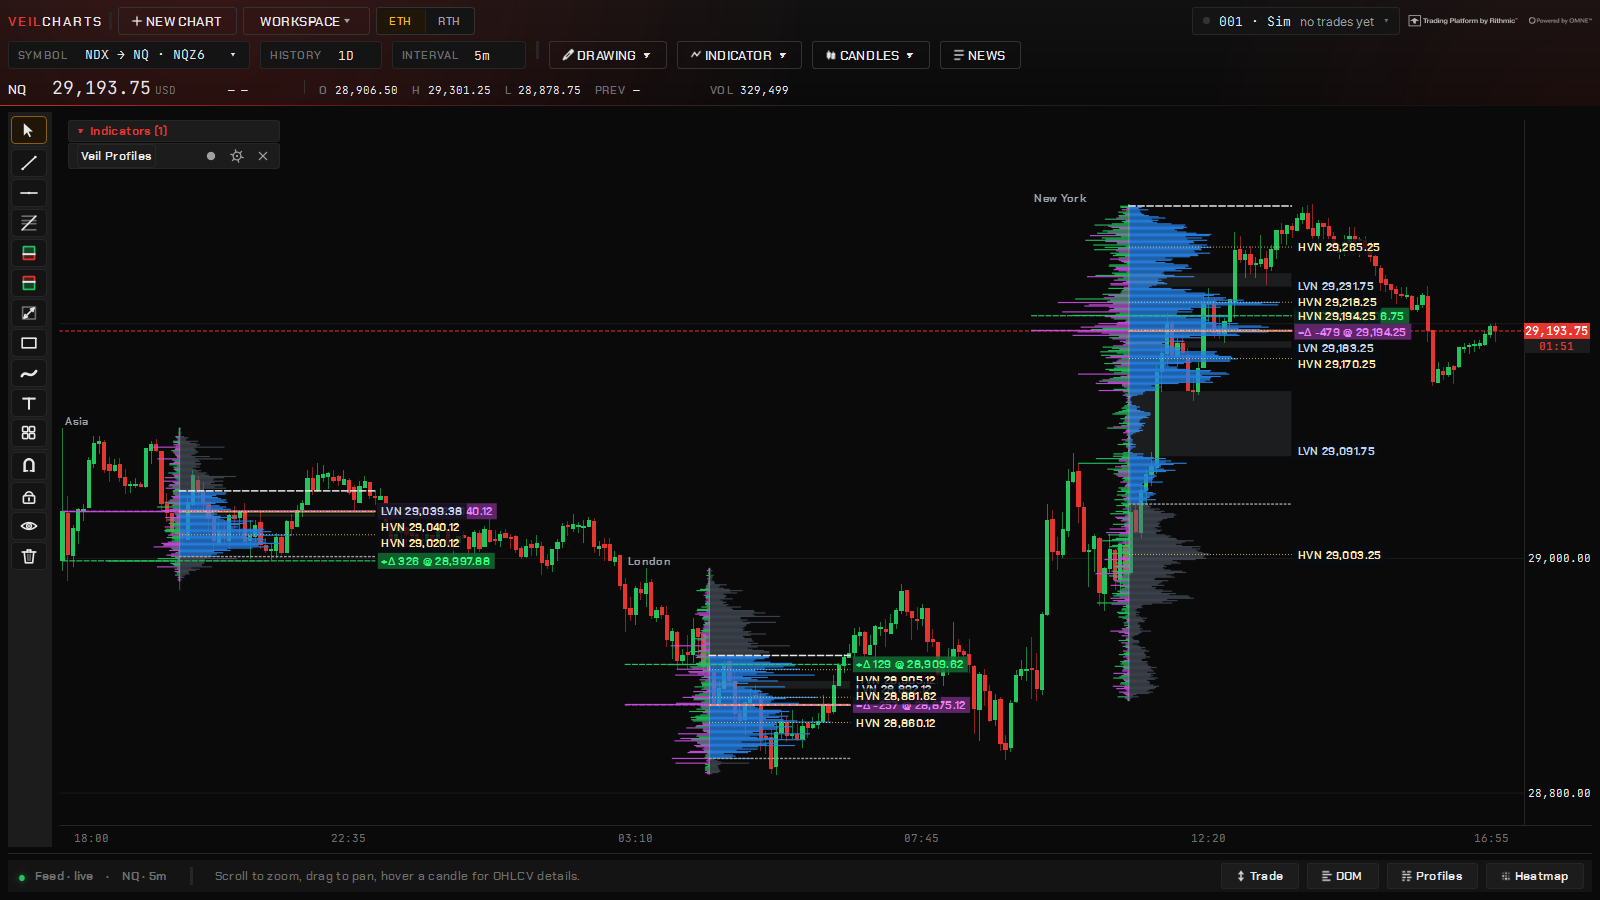
A profile turns a range of bars on its side: at each price, how much traded. Chartveil builds every profile from stored ticks, not from bars, so VAH, VAL and POC land on the exact tick they belong to.
Three tools draw profiles:
- Veil Profiles — the study, auto-anchored to sessions, days, weeks or a composite. This chapter.
- Veil Profile — the drawing, over any range you choose. See Drawing tools.
- The Profiles dock — a column at the edge of a chart or heatmap that runs the full height of the window.
The vocabulary
- POC — point of control, the price with the most volume in the range.
- Value area — the band around the POC holding a set share of the range’s volume, grown out from the POC one level at a time. Its edges are VAH and VAL. The convention is 68 % — the one-standard-deviation figure it derives from; 70 % is a rounding that stuck. Set Value area % either way.
- HVN / LVN — high- and low-volume nodes, the peaks and valleys of the shape, marked with how pronounced each one is.
Veil Profiles — the study
Indicator ▾ → Volume & Order Flow → Veil Profiles. One study, five modes:
| Mode | The question |
|---|---|
| Volume | How much traded at each price |
| Delta | At each price, who was the aggressor — a high-volume level where selling hit the bid reads very differently from the same volume lifted at the ask |
| Delta + Volume | Both, side by side |
| Bid / Ask | The split at each price |
| TPO Profile | Time at price, as letters — below |
Period anchors the profile: Session, ETH / RTH, Overnight, Daily, Weekly, Monthly, a number of minutes, the latest bars, the visible range, or a Composite of several periods. Profiles shown is how many are drawn back — six covers a trading week and redraws instantly; it is the first thing to turn down if a chart feels heavy.
Other settings: input data (volume or number of trades), min and max trade size filters, peaks and valleys with their sensitivity, volume coloured by value area or as heat, a summary line and the profile’s own VWAP over each profile, and the developing POC and value area.
Developing POC, VAH and VAL
The value area as it built, stepped bar by bar through the session — so you can see where the fair-value band was when the trade you are reviewing was open, not just where it finished. Switch on developing POC and developing VA; the delta POC has its own switch.
The TPO profile
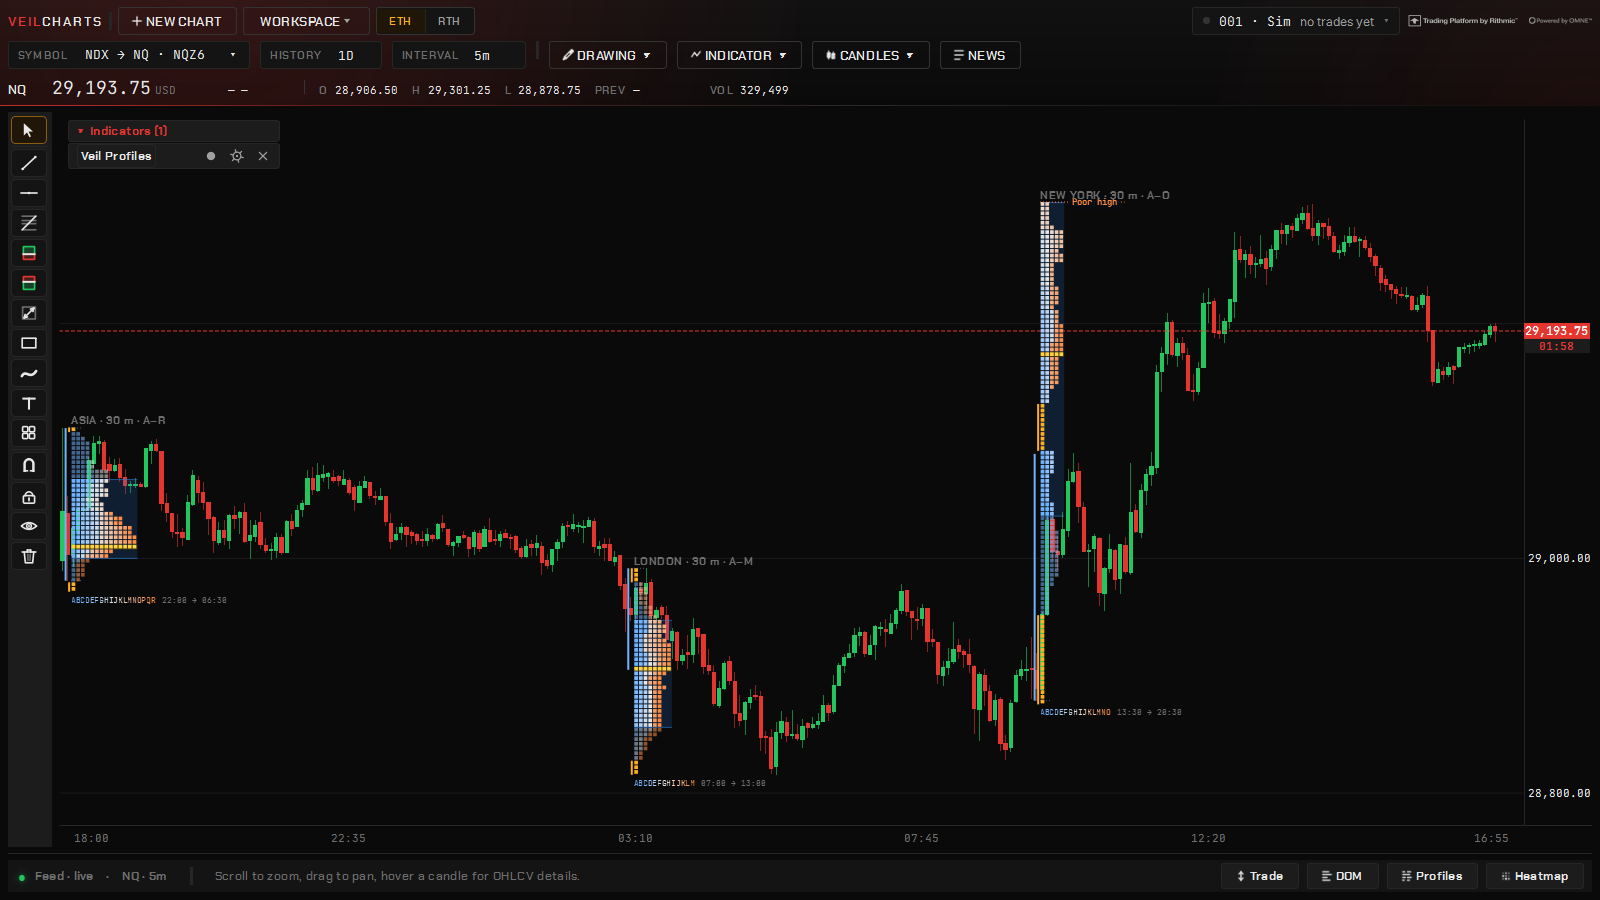
The classic letter profile: each letter is a time period that traded at that price, so the shape shows time spent where a volume profile shows size done. Balance, single prints and poor highs and lows read at a glance.
The letters are inked by when they printed — the opening periods in blue, the middle of the session in white, the last periods in orange — with no cell fills to bury them, so you can see which part of the day built a shelf. The value area and the POC are washes, every single-print run gets a rail, the initial balance is marked, poor highs and lows are flagged, and a key under the profile names the periods. Zoomed out, the letters give way to blocks and then to a silhouette rather than disappearing.
Settings: TPO bracket (minutes per letter, 30 by default), ticks per row, column width (scales the letter pitch from half a row to three), which side the letters sit on when paired with a volume profile, the letter colour (Time ink or one colour), the IB period count, and the companion profile drawn beside the letters. Any other mode can add TPO beside it.
The Profiles dock
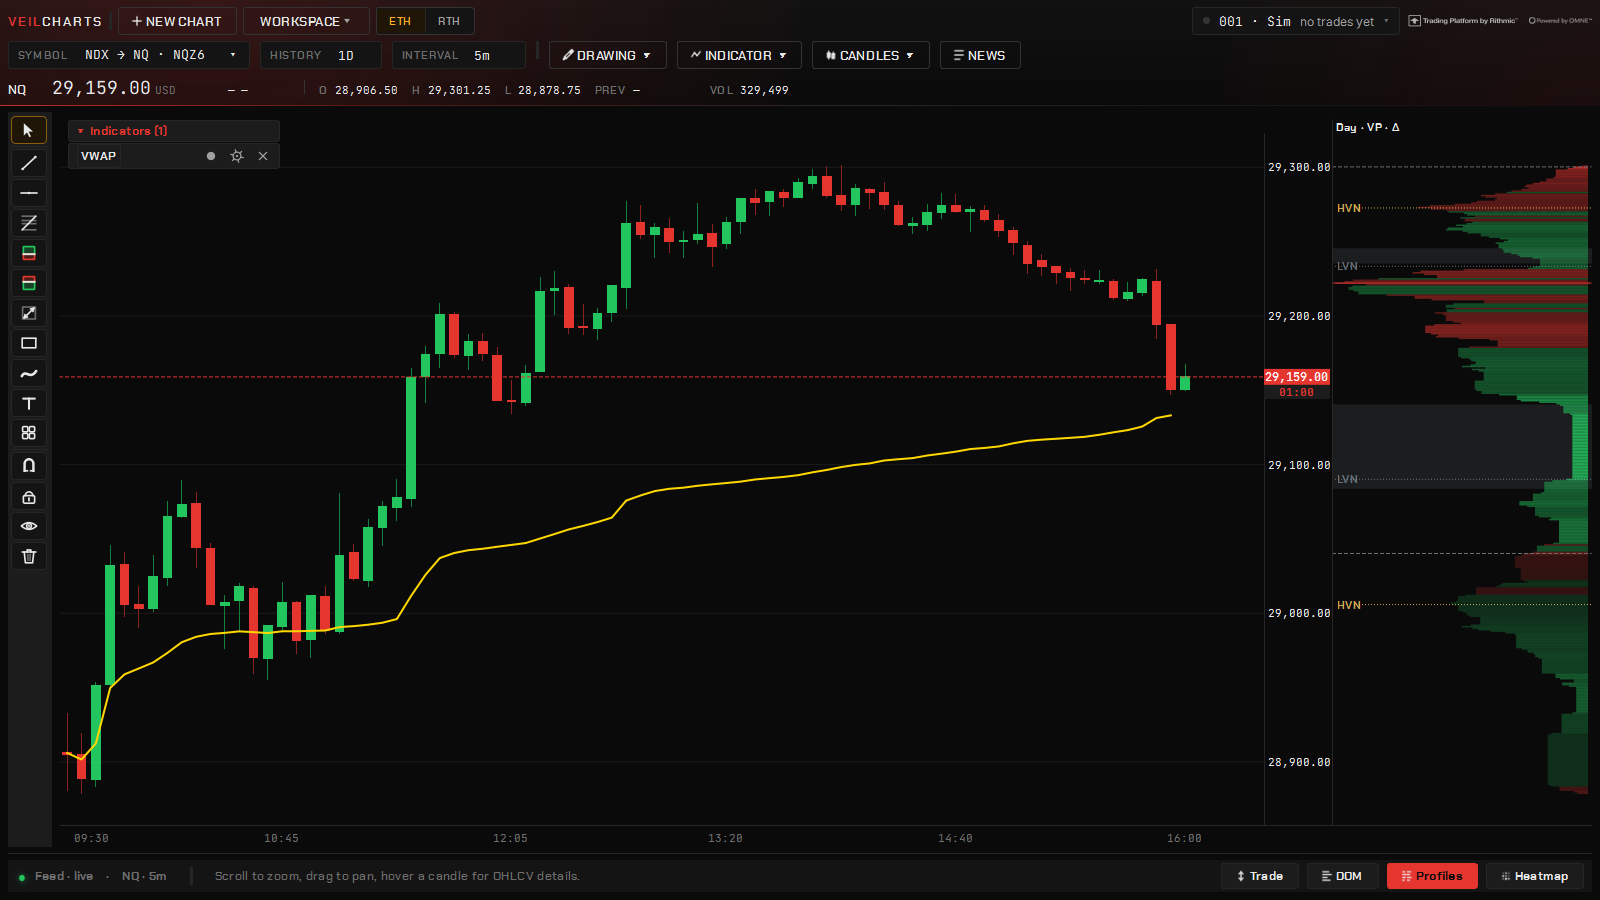
A profile column at the edge of any chart or heatmap that runs the full height of the window — on the heatmap it continues below the map, through the volume and delta bands, on the map’s own price scale. Open it from the chart’s or the heatmap’s right-click menu.
- Data per column: Volume, Volume coloured by delta, Delta, Bid / Ask split, or TPO.
- Period: Day, Week, Month, or the visible range.
- Move left / right to reorder columns, and a width per column: narrow (½), normal, wide (1½) or double.
- Peaks and valleys are marked on the column, and a switch extends them across the chart as levels — the dock is where the HVN chips on the chart come from.
- The bracket and row knobs for a TPO column are in the dock menu and in the heatmap’s Settings.
Veil Bar Stats
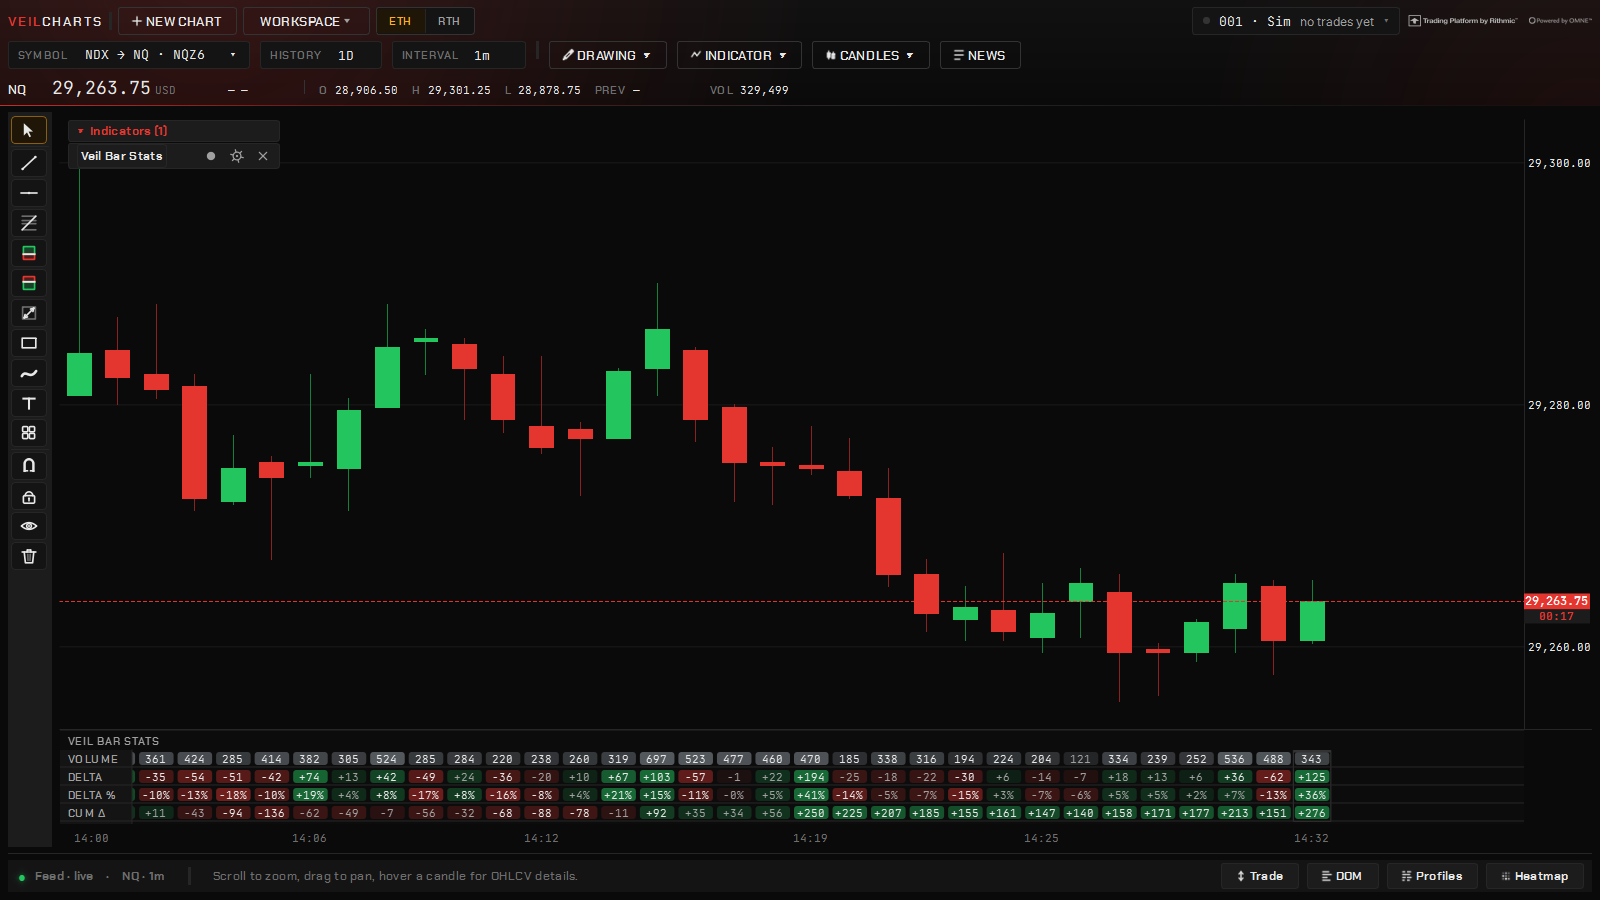
A table under the chart with one column per bar — volume, delta, cumulative delta, the extremes and whichever rows you switch on — as tiles in the same mono digits as the footprint cells, tinted by intensity, with the live bar outlined and the crosshair’s column washed. It keeps up when you zoom all the way out. Indicator ▾ → Volume & Order Flow → Veil Bar Stats.
Reading the shapes
- A negative delta node at a high means sellers were the aggressors into that level and price held there anyway — which usually means passive buyers absorbed them. Absorption at a high is a different signal from buying at a high.
- The profile shows where trades happened; the heatmap shows where orders are waiting. Read them together.