The Veil studies
The order-flow and structure studies that are Chartveil's own — delta, CVD, big prints, sessions, VWAP, the book on the chart, levels, divergence and the calendar.
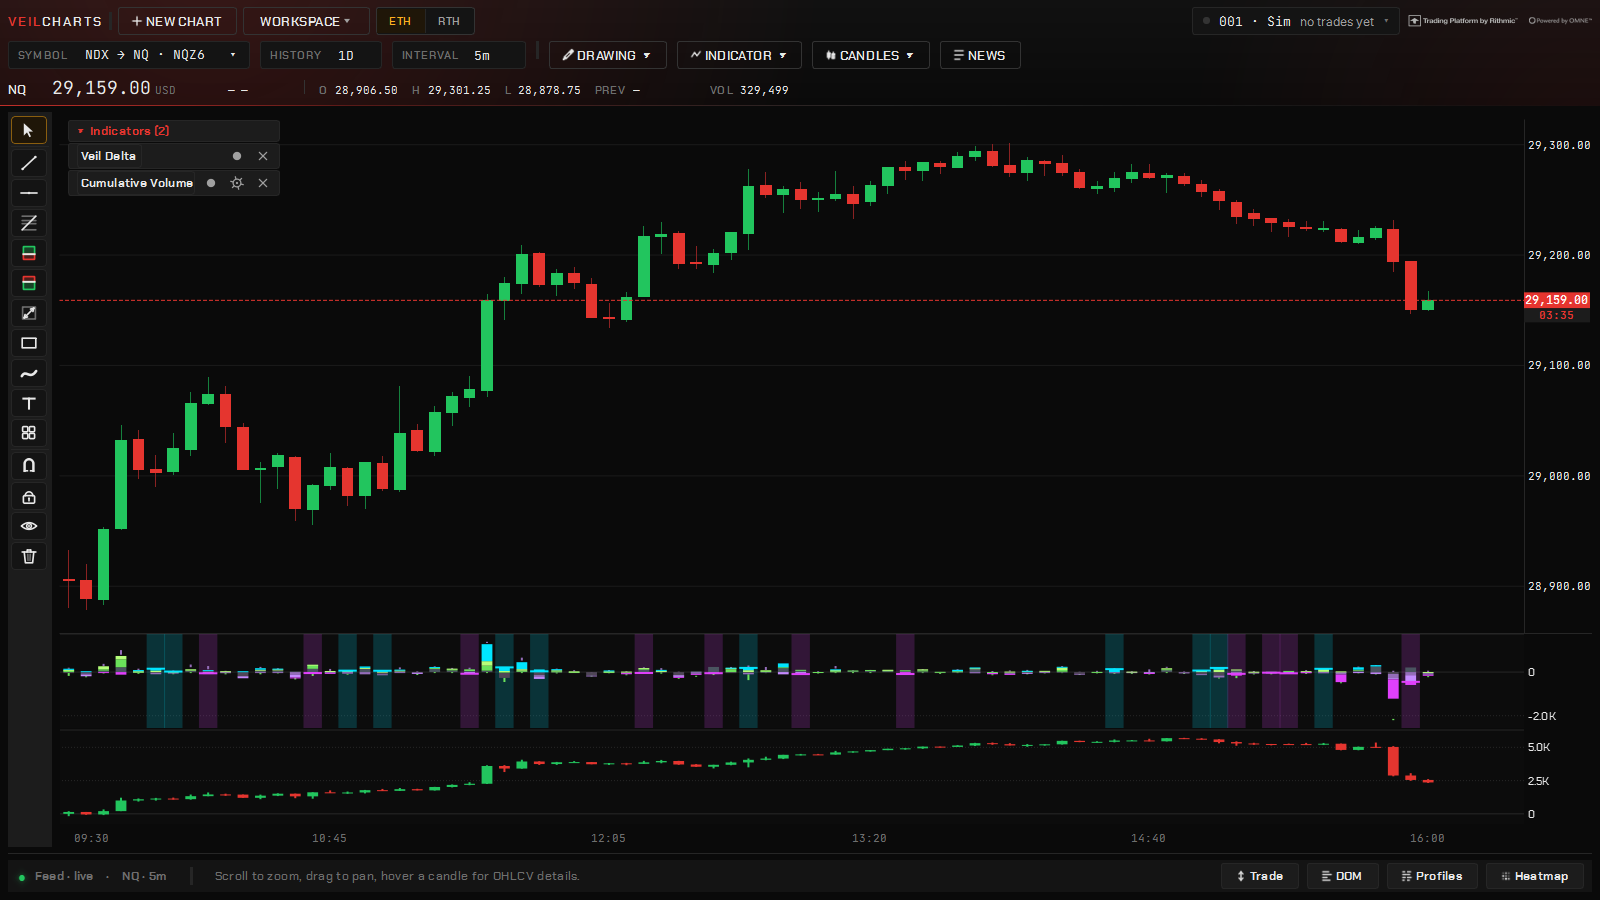
Every study named Veil is built in-house on the shared tape and lives in the picker’s Volume & Order Flow section. Veil Print and Veil Profiles have chapters of their own — Veil Print, Profiles — and the gamma studies are under Dealer positioning. The rest are here.
Veil Delta and Cumulative Volume Delta
Veil Delta is a pane of per-bar delta — buying minus selling, bar by bar. Cumulative Volume Delta runs the total across the session, which is where divergence lives: a higher high in price on a lower high in CVD says the push had less aggression behind it than the last one — a common thing to look for, and a common thing to over-read.
Both panes scale three ways — automatic, symmetric around zero, or a manual range — and like every pane you can drag the body to move it, drag its own axis to zoom it, and double-click the axis to refit. CVD resets at the 18:00 ET session, the New York open or rolling; the heatmap’s CVD band uses the same choices.
Veil Trades and Veil Grouped Trades
Veil Trades draws the largest individual executions as bubbles at the price and moment they happened, sized by contracts. One 80-contract print is information; the same size spread across forty small prints is noise, and this study only shows you the former. The filter is automatic by default — it adapts to what counts as large on the instrument that day — or set a manual floor and ceiling when you only want a specific size band. The floor is shared with the heatmap’s bubbles and Time & Sales.
Veil Grouped Trades reassembles a burst of fills milliseconds apart into one bubble per aggressive order, so a 150-contract sweep reads as a 150-contract decision instead of a scatter of fragments.
Veil Bar Stats, Veil Candle Stats
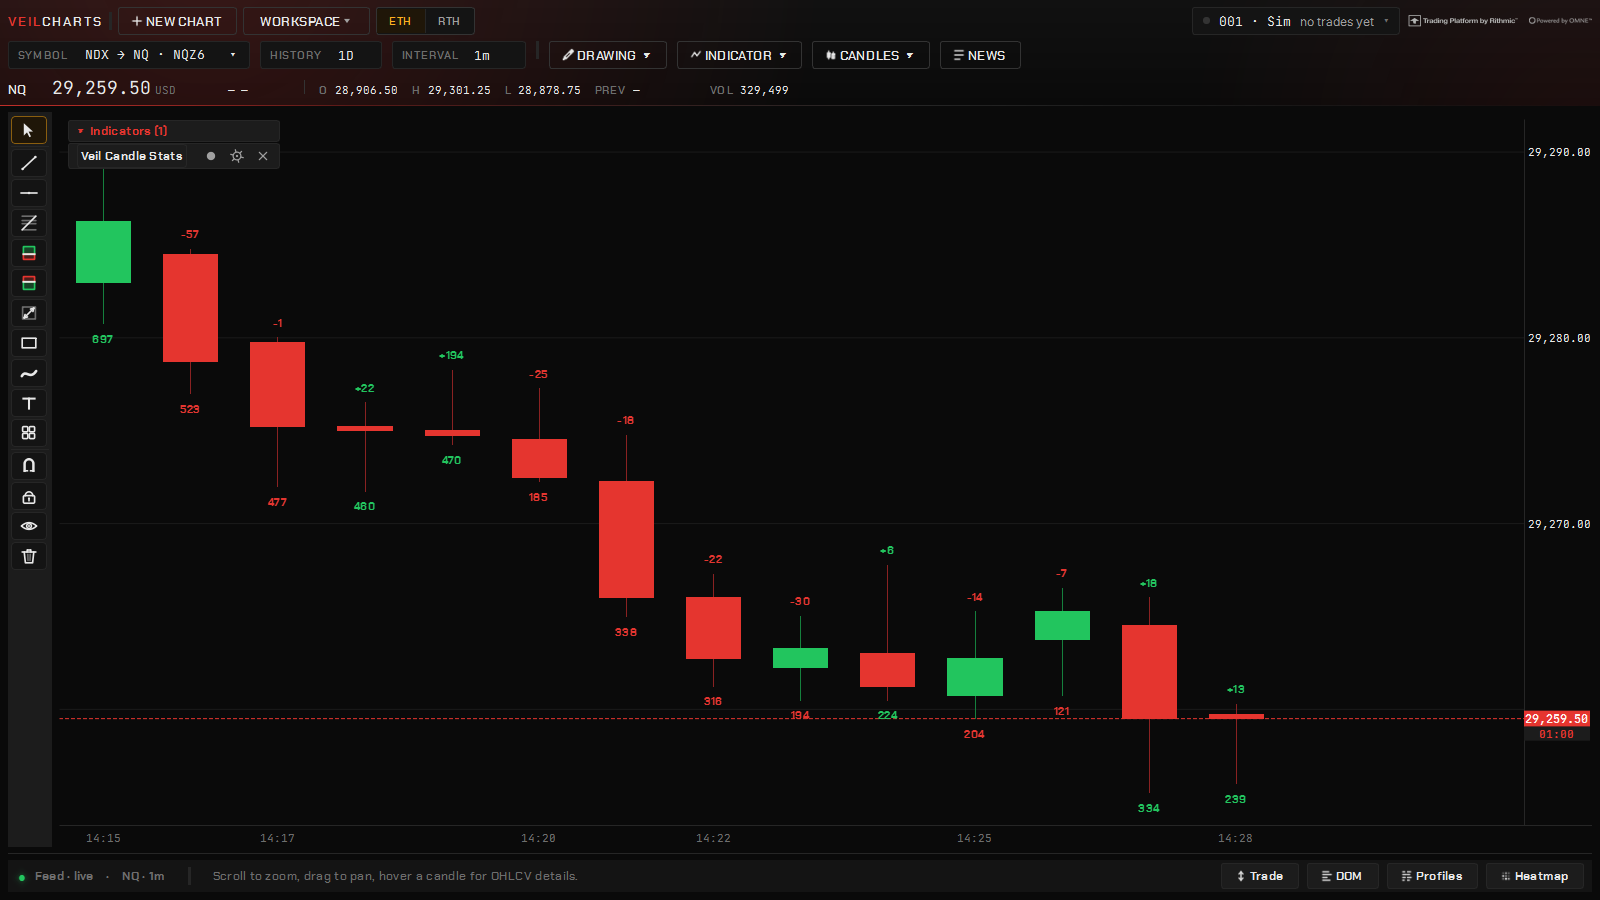
Three readouts of the same per-bar numbers. Veil Bar Stats is the table under the chart — see Profiles. Veil Candle Stats prints two of the numbers on the candles themselves — one field above the high and one below the low (delta above, volume below by default), coloured by delta sign, hidden automatically when the candles are too narrow to carry them.
Veil Depth and Veil Depth of Market
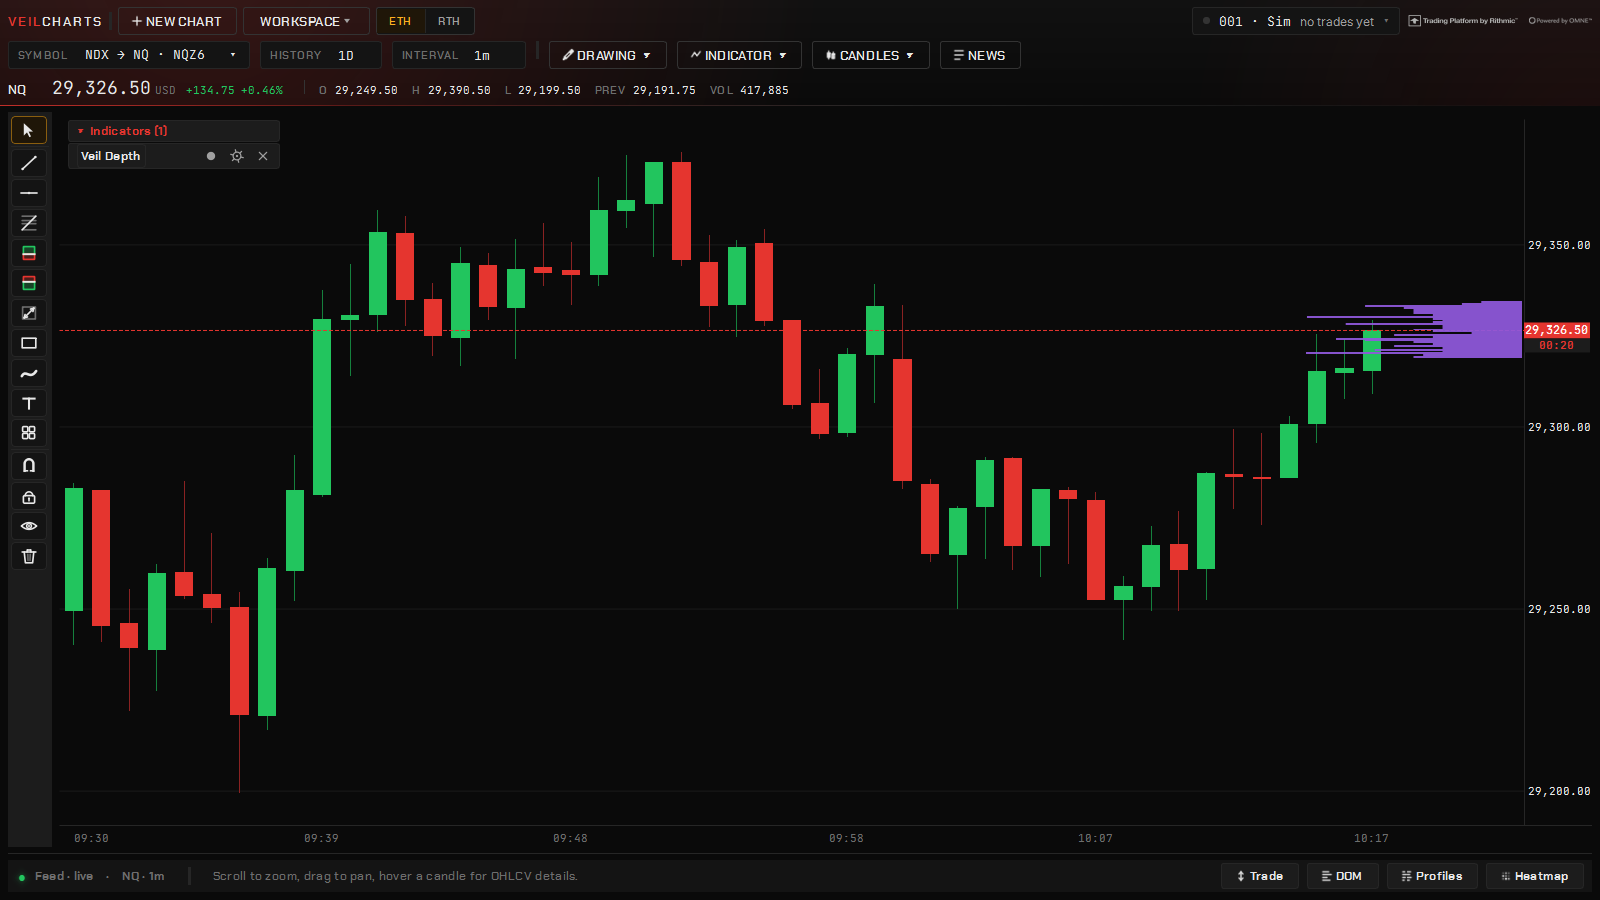
Two ways to put the book on the chart:
- Veil Depth — the book as it stands right now, as bars at the chart’s edge, one per level, drawn the way the heatmap’s ladder draws them: tiled rows, the size printed on the bar, the heaviest levels lit. Settings: how far above and below the last price to look, a per-level contract filter, the column width, and what the rows print (total, biggest × total, or nothing).
- Veil Depth of Market — the heatmap on the candles: every resting limit order the book has shown while the session recorded, painted at its price and the time it rested there, straight over the bars that traded through it. One colour per side; a level’s size is carried by how solid and thick its band is. Only levels at or above the minimum size (15 contracts by default) produce heat, and the filter bites per level, so a cluster of small orders can never sum its way past it. A ladder against the price scale prints biggest × total, the biggest level per side boxed.
Both need Level 2.
VWAP with deviation bands
Volume-weighted average price, anchored to the trading day or to the New York cash session, with ±1σ, 2σ and 3σ bands computed volume-weighted rather than eyeballed. The same engine draws it on the chart and on the heatmap, so the two never disagree about where it is. For a VWAP anchored to a bar of your choosing, with resets, see Drawing tools.
Sessions
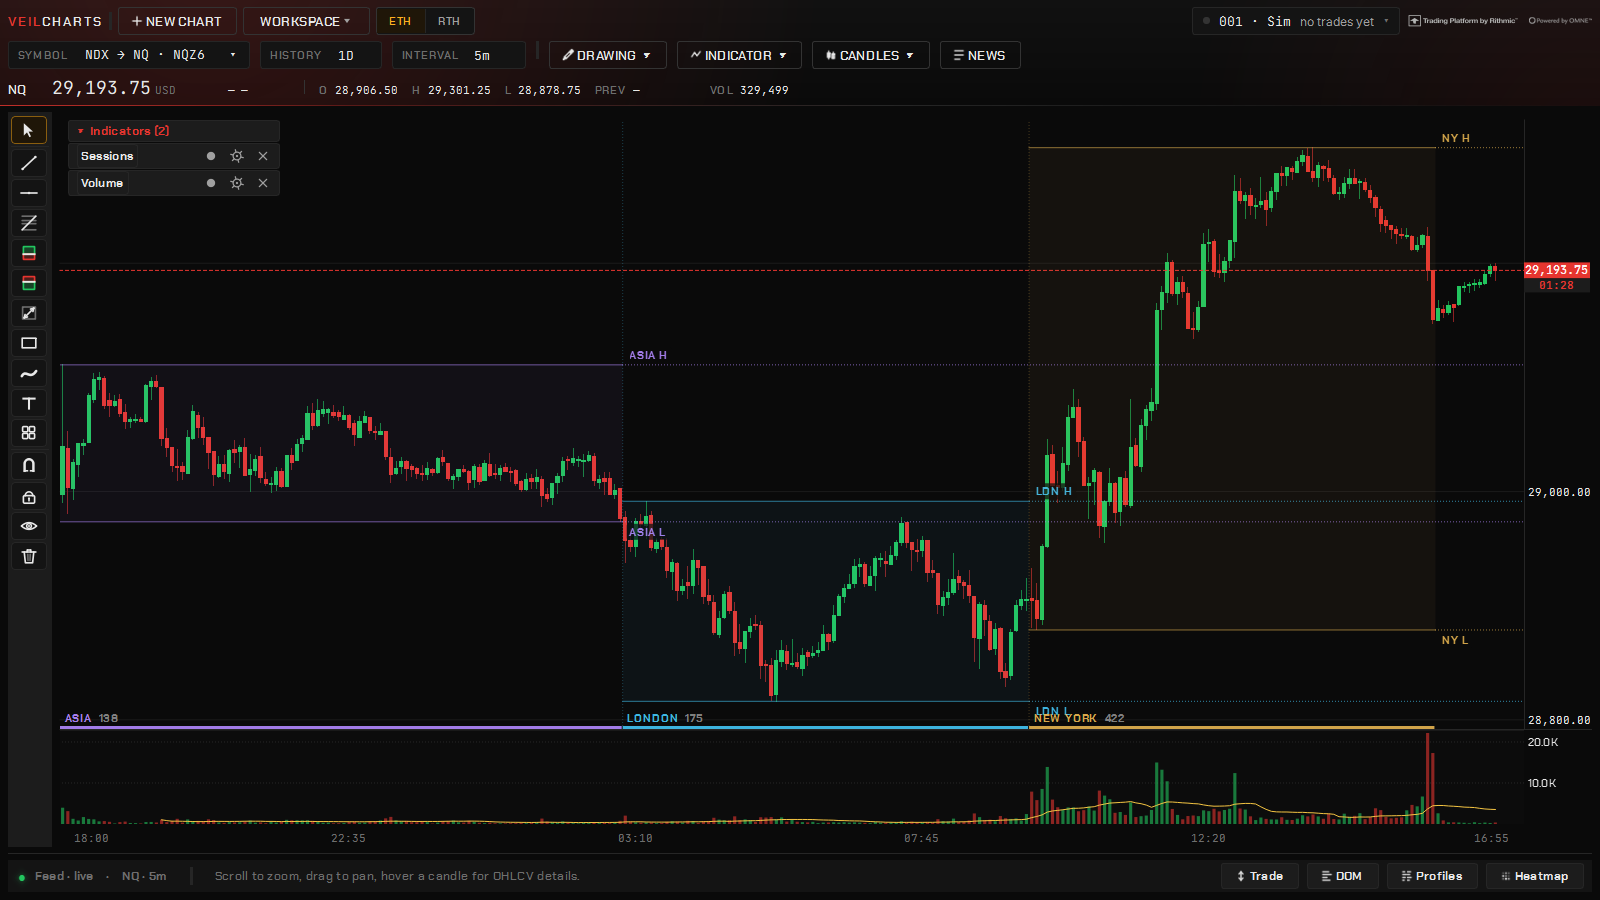
Asia, London and New York — and one custom window — on the chart as a rail along the bottom in each session’s colour, so which desk is on reads like a timeline and never touches a candle. Each session’s high and low are carried forward as levels, its hours are echoed in the label, and a clock chip says which session is open and for how much longer. History is counted in days, so the rail reads the same on a one-minute chart and a fifteen.
Veil Levels
The reference prices a day is traded against, as rails across the session they apply to and labelled on the price scale: the previous day’s high, low, mid and close; the previous cash session’s VAH, VAL and POC (the open-drive read — did we open in or out of yesterday’s value? — is made against exactly these); the previous full electronic session’s value area; the overnight high and low, drawn from the cash open onward, which is when they stop moving and start being levels; and the day’s own developing high and low. Each level is an independent switch with its own colour. Several of them can be alerts.
ADR Levels
Average daily range, projected as levels from the day’s open — recomputed per day from that day’s trailing range history (14- and 7-day look-backs by default), so the boxes step from day to day. When the day has already travelled its average range, continuation is statistically the harder trade; these levels put that fact on the chart.
Structure
A market-structure overlay: ZigZag swings confirmed by an EMA-pullback rule, so the structure of a leg and the highs and lows that matter read at a glance, with the swing points labelled. Context for where price is in a range and which way it is leaning.
Veil SMT Divergence
The two index futures usually move together. When one makes a new high or low and its sibling refuses to confirm it, that disagreement — smart-money divergence — is marked on the chart automatically: bearish at swing highs, bullish at swing lows. It is context for a level, not a signal on its own.
Veil QQQ Levels
The whole-dollar QQQ ladder — 700, 701, 702… — drawn on an NQ chart at its NQ equivalent, and SPY’s on ES, through one held ratio that steps only when the smoothed live ratio has really moved, so the levels sit still instead of shivering with every quote. The ratio is printed on the chart and kept between sessions; the study can also carry your own QQQ numbers and QQQ’s prior close, open and day range. The lock mode — steady, session lock, live or fixed — is a setting.
Veil RSI Candles
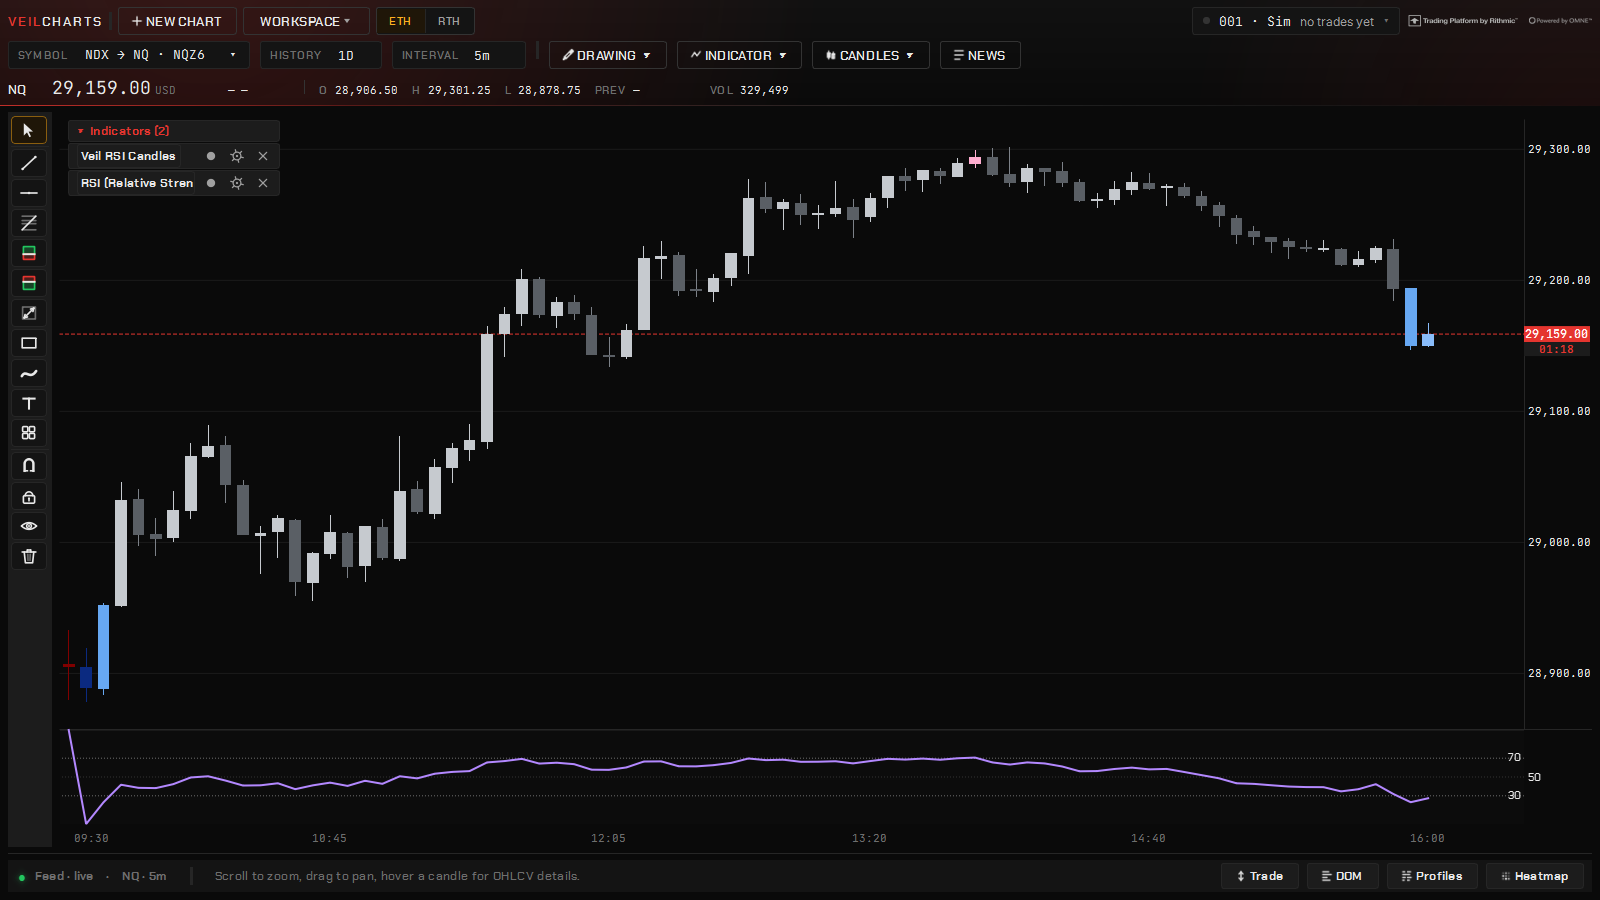
The bars repainted by where RSI sits: overbought bars (RSI ≥ 70 by default) in one ramp, oversold bars (≤ 30) in another, body, wick and border all taking the one colour so a hot bar reads at a glance; every other bar is left neutral.
Veil Economic Events
Scheduled macro releases — CPI, NFP, FOMC and the rest — drawn as markers at the minute they print, with upcoming events projected into the right margin. Date confidence is honest: a confirmed date draws solid, an estimated one draws dashed with a ?, and nothing is extrapolated past what is published. The schedule works offline. Add a free statistics key under Chart settings → Data and past markers also carry the actual and previous prints as they were first published. The same calendar drives the News pane.