Standard indicators
Moving averages, Bollinger Bands, VWAP, RSI, MACD, Stochastic, ATR and Volume — the standards, done properly.
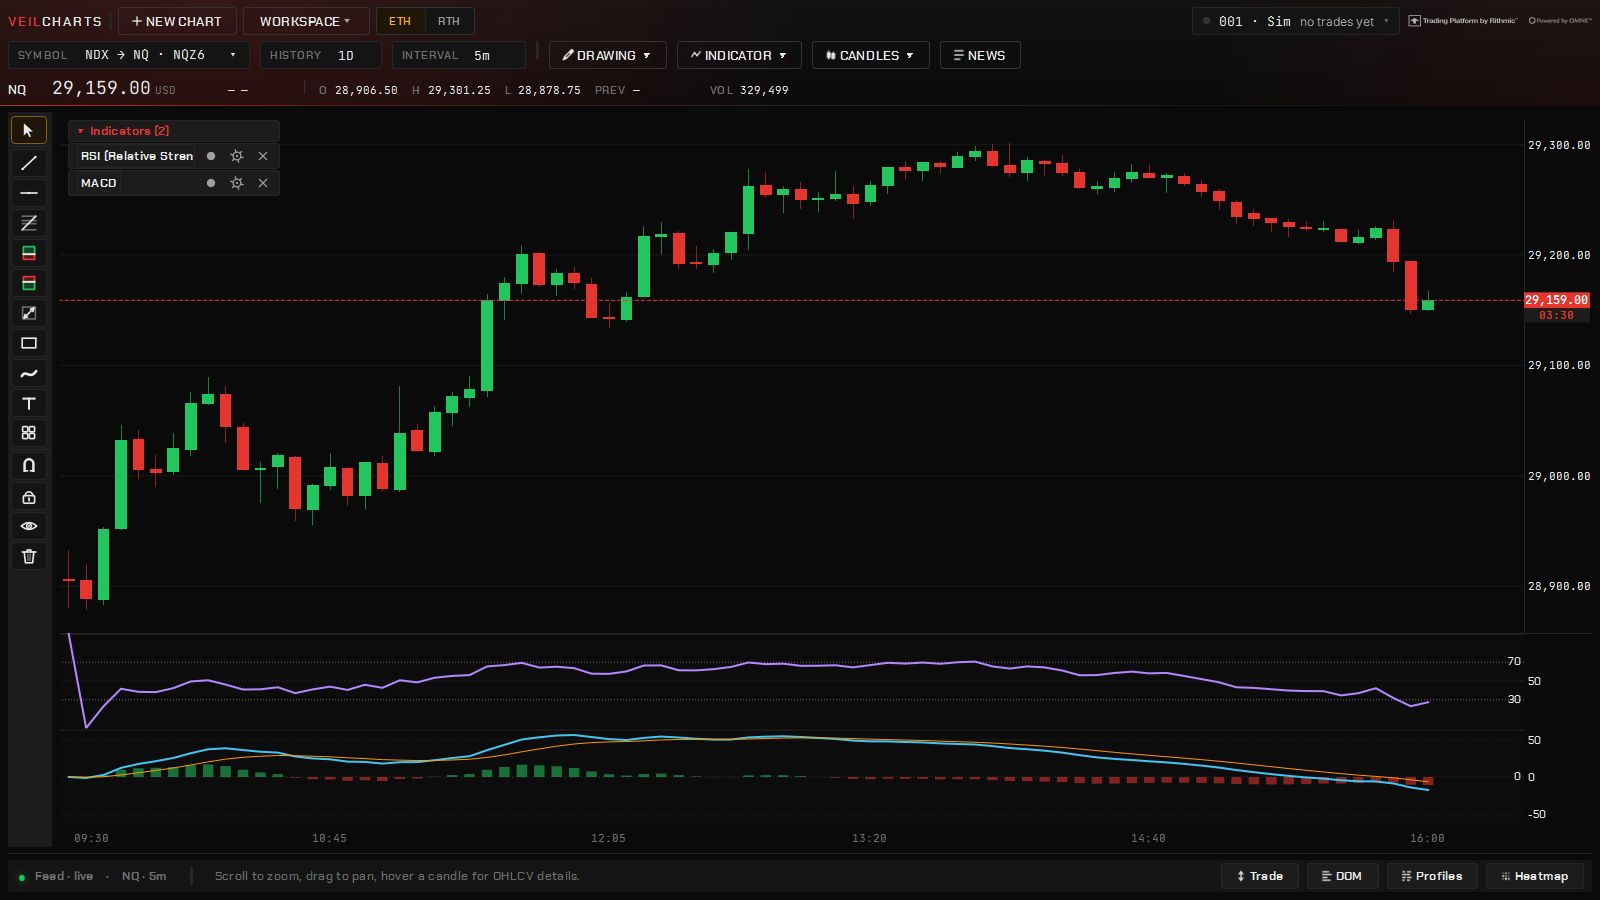
The standards are all here. They read the chart’s bars — whatever bar type is on it — and the oscillators draw in their own panes, sharing the chart’s crosshair.
Moving Average
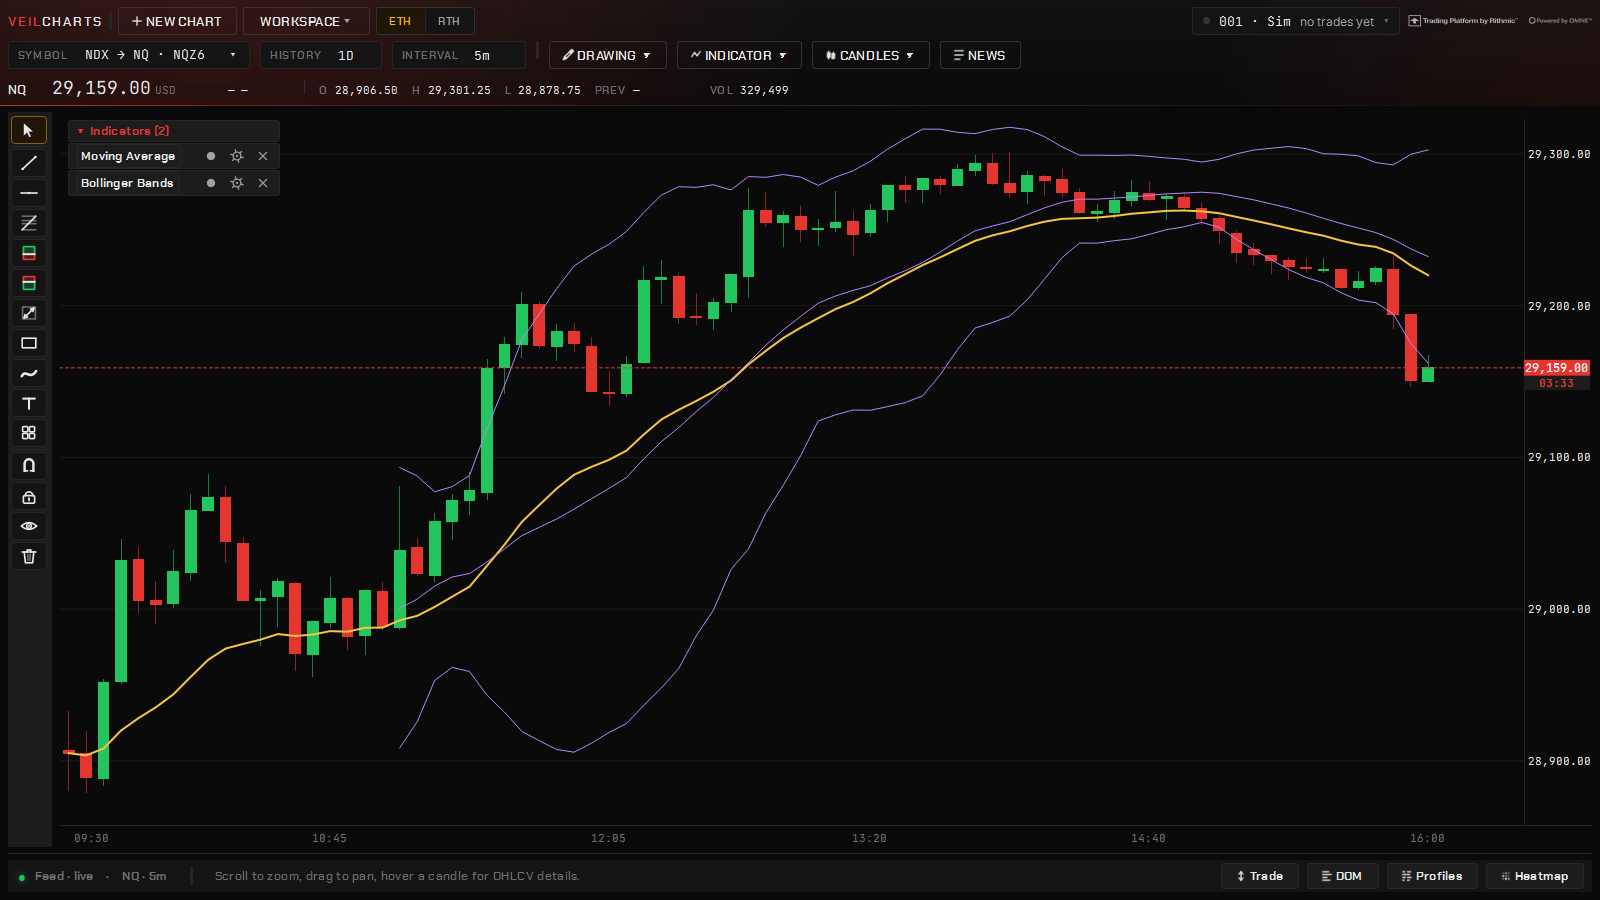
One study with fourteen types: SMA, EMA, WMA, Wilder’s RMA, Hull, DEMA, TEMA, triangular, VWMA, ALMA, least squares, Kaufman adaptive, zero-lag EMA and Tillson T3. Set the length and the source, and switch on trend colouring to tint the line by its slope. Add the study twice for a fast and a slow line.
Bollinger Bands
A moving average with bands a set number of standard deviations either side. Length, multiplier and the average type are settings.
VWAP
The session VWAP with volume-weighted deviation bands — described under the Veil studies. It is listed under Basic Indicators in the picker.
Oscillators
| Study | What it shows |
|---|---|
| RSI | Relative strength over a length, with the overbought and oversold lines |
| MACD | The fast and slow EMA difference, its signal line and the histogram |
| Stochastic | %K and %D over a look-back |
| ATR | Average true range — the size of a bar’s travel, useful for stop distances in ticks |
| Volume | Volume per bar, coloured by bar direction, with an optional volume moving average |
Every oscillator pane is mouse-scaled: drag to move, drag its axis to zoom, double-click to refit, and an auto-focus pill brings it back when you wander. See Managing studies.
Alerts on a study
Any study’s output can be an alert — its value against a number, crossing up or down. Right-click the chart → Alert at… and pick the study. See Alerts.