Charts
The chart window — bar types built from ticks, the header, moving around, colours and appearance, and what to do when a chart looks wrong.
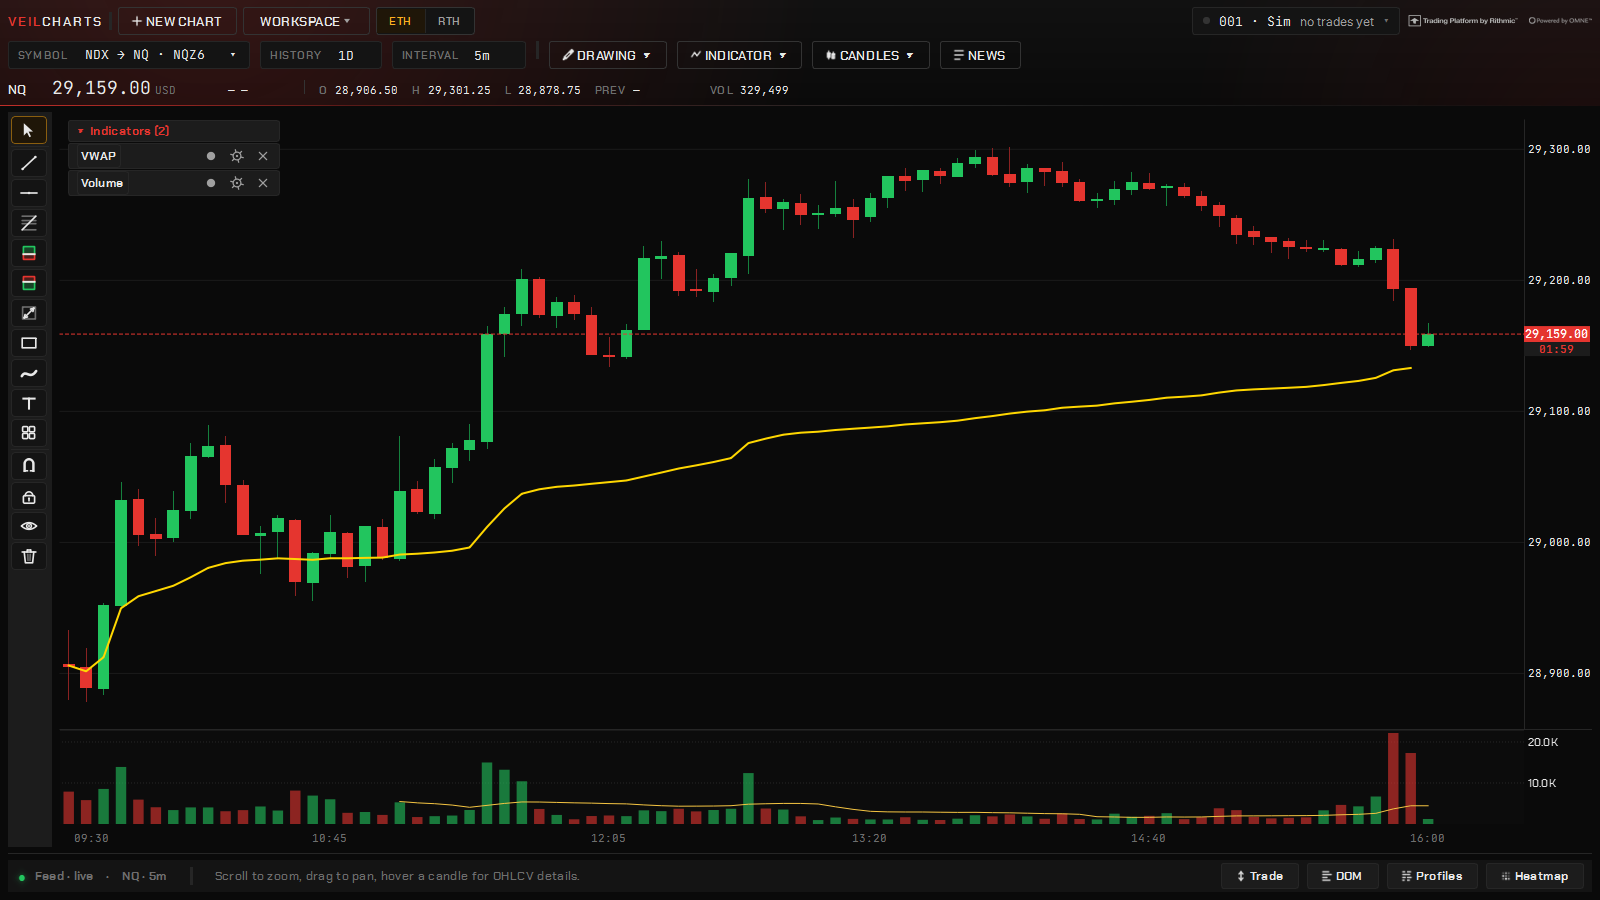
The chart is where the order flow sits. Every bar type is built trade by trade from raw stored ticks, six markets are one chip away, and the same window carries the studies, the drawings, the order ticket and your position.
The header
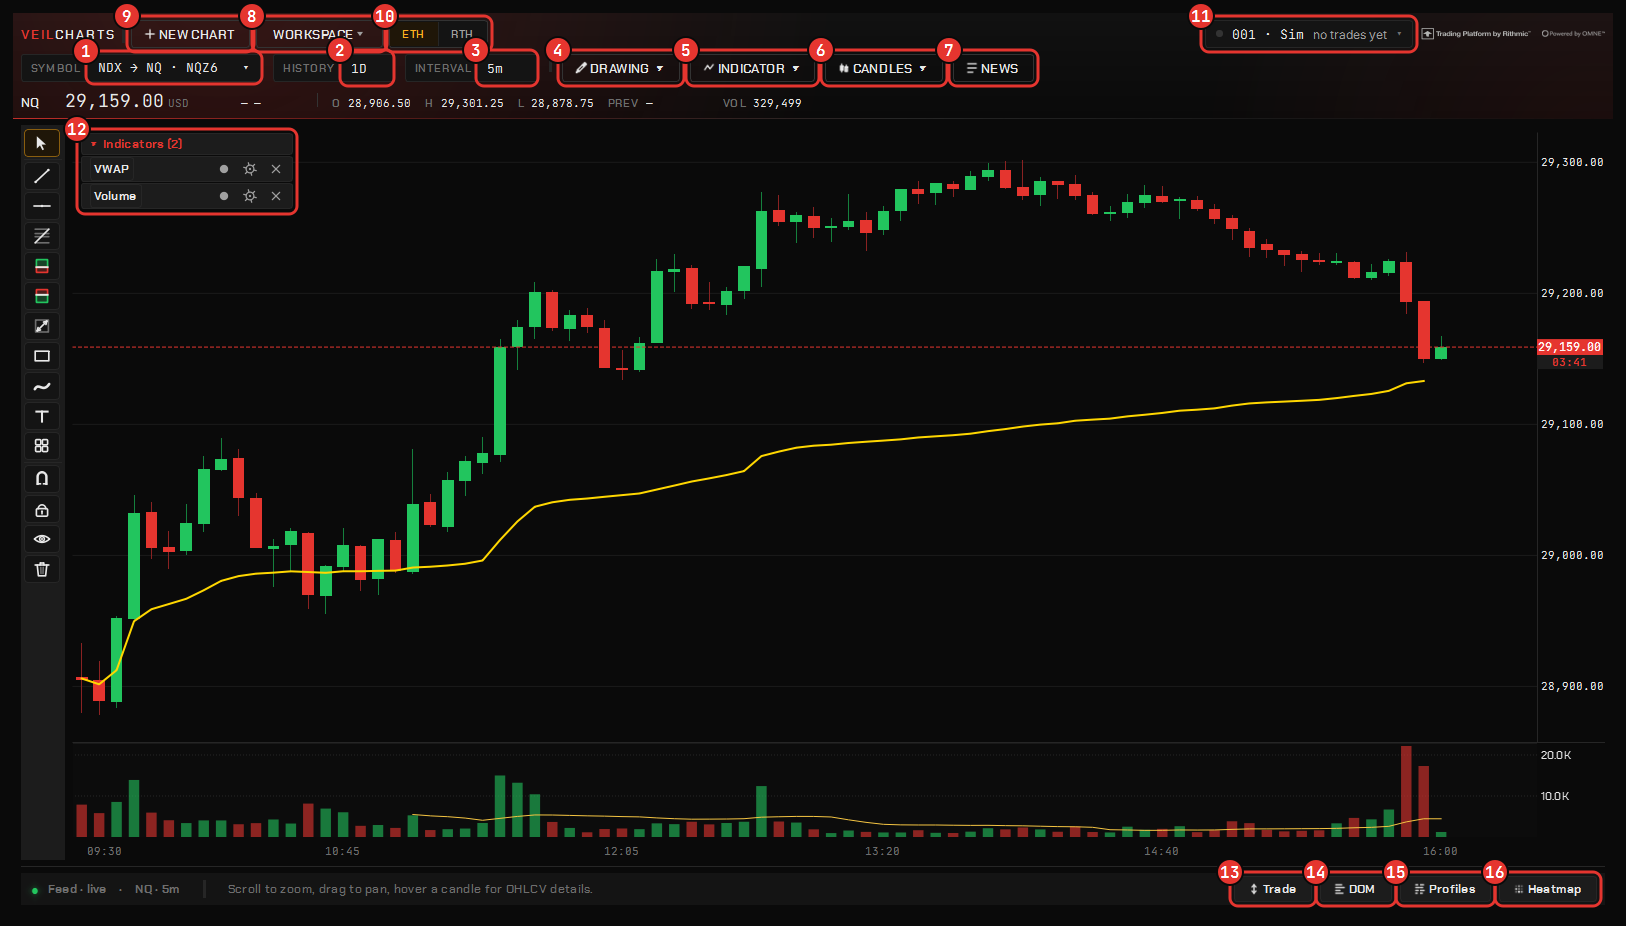
From left to right:
- Instrument chip — the contract on this chart. Click it to switch market or contract month. Chart NQ and trade MNQ if you like; the position draws on the chart you are watching. See The order ticket.
- Interval / size box —
5m,1h, or the size of a non-time bar: on a range chart it readsRANGEand the number is the bar’s size in ticks. - Chart type — candles, and the non-time bars described below.
- Indicator ▾ — the study picker, grouped into Basic Indicators, Volume & Order Flow and Gamma DP. See Managing studies.
- Drawing ▾ — the drawing picker. See Drawing tools.
- News — opens the economic calendar pane. See News & the calendar.
- Workspace — save, switch, share and import layouts. See Workspaces.
- New chart — another chart, as a tab by default on a single screen. Shift-click for a window.
- Options-chain chip — on NQ and ES only: which options book the dealer-positioning studies read (NDX or QQQ on NQ, SPX or SPY on ES). See Gamma studies.
- Trade chip and P&L — the account the ticket is on and the open position.
When the window is squeezed the header degrades in stages — the chip loses its word, then the P&L, then the buttons become icons — and the price marks are the last thing to go. Nothing is hidden that you cannot get back by widening the window.
Bar types
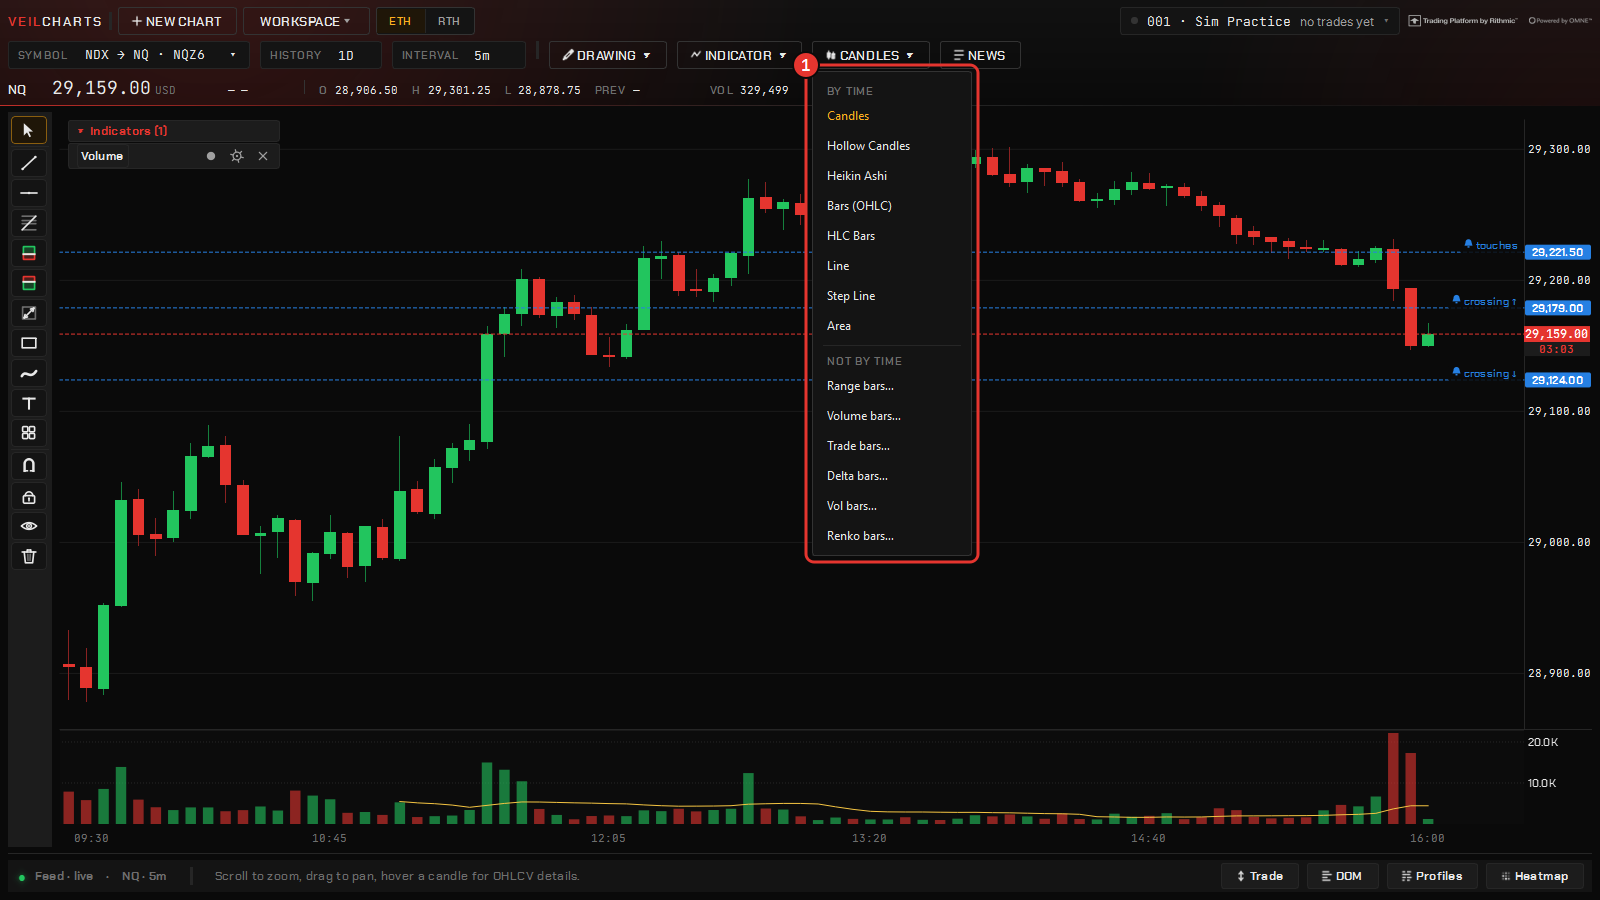
Beyond time bars:
| Type | A bar closes after |
|---|---|
| Range | N ticks of travel |
| Volume | N contracts |
| Trade | N prints |
| Delta | N contracts of imbalance |
| Vol bars | travel, then a pull-back |
| Renko | a brick of N ticks |
All are built from raw stored ticks rather than resampled from minute data. A range bar resampled from one-minute data cannot know where inside that minute the range completed, so its opens and closes are wrong; building from ticks removes the guess. Every bar type carries a footprint, because they are all built from the same tick history.
To pick one: open the chart-type menu, choose the type, and type its size once. The interval box becomes the size box — changing a 40-tick range chart to 60 is typing where it says RANGE. Picking any candle type takes you back to time bars.
Moving around
| To | Do |
|---|---|
| Zoom time | Scroll over the bars, or drag the time axis |
| Zoom price | Drag the price axis |
| Refit price to what is on screen | Double-click the price axis, or right-click → Fit price to view |
| Let the scale follow price again | Right-click → Auto-scale |
| Pan | Drag the chart |
| Move or scale a study pane | Drag the pane’s body to move it, drag its own axis to zoom, double-click the axis to refit; an auto-focus pill brings it back when you wander |
Six markets
NQ, ES, YM and RTY and the metals GC and SI, with their micros (MNQ, MES, MYM, M2K, MGC, SIL), including explicit quarterly contracts — on the charts, the ladder, the heatmap, every study, the copier, the Auto Trader and the Risk Manager. Metals contracts roll ahead of first notice day. The dealer-positioning studies stay on NQ and ES, because those are the futures the index options price; on any other chart they say so rather than drawing nothing.
An expired contract month is refused for history — that is the data provider’s rule, not the terminal’s. Use the front month or an explicit quarterly that has not expired.
Chart settings
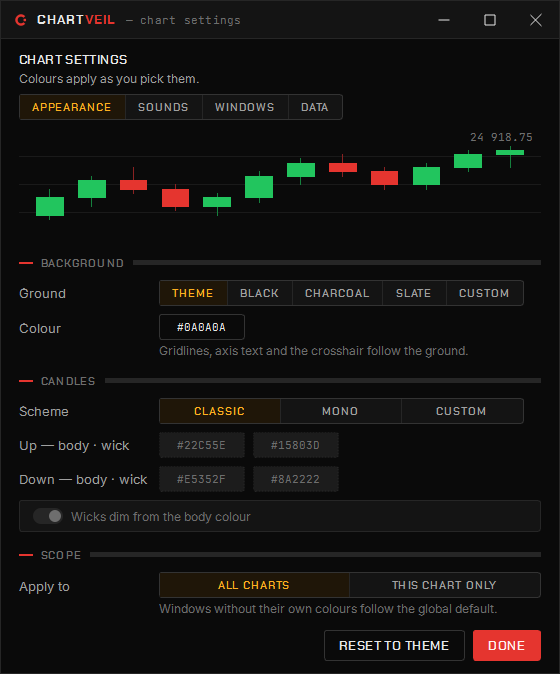
Right-click → Chart settings… (Ctrl+,) has four tabs:
- Appearance — the background and the candle colours: a classic scheme, a monochrome one, or your own four colours. Set them once as the global default for every window, or override a single window and the override rides in the workspace. The heatmap paints the same ground and the same candles, and the order ticket’s buy and sell carry the candle colours too, so a change here changes the whole desk consistently. A light background gets dark gridlines and axis text automatically.
- Sounds — order events spoken, chimed or your own files, and the spoken economic-release warnings. See Exits, sizing & sounds.
- Windows — whether a tool opens in the desk or in a window, and whether a new chart opens as a tab or a window.
- Data — the opt-in headline feeds and the free statistics key for the calendar. See News & the calendar.
When a chart looks wrong
- “No chart data” — in order of likelihood: the feed is not connected (check the chip in the Command Center); it is the maintenance break, 17:00–18:00 ET; or the contract month has expired. If the feed is up and the contract is live, right-click → Reload chart.
- A hole, or a bar that looks wrong — right-click → Reload chart. The contract’s history is requested again and the bars are overwritten in place: stale ones dropped, your drawings, view and scale kept, and no other window on that contract goes blank while it happens. If the hole comes back, note the time window and report it.
- A price on the scale that is not a multiple of the tick — a display fault worth reporting with a screenshot.
Your past trades on the chart
Right-click → Historical orders draws every closed trade from your journal on the bars it happened on, entry to exit — the arrow in tells you the direction, the connector and the exit marker how it ended, and the money made or lost sits at the exit. History settings… on the same menu picks the account, how many days to reach back and what the exit label shows. It is the fastest way to review a session on the chart it was traded on.