Start with who has to hedge
Most index options are sold to customers by market makers — dealers — who do not want a directional position. They hedge by holding the underlying against the options book, and they re-hedge as the market moves. Gamma is the rate at which their hedge has to change when price moves one point. Add it up across every strike and expiry, sign it by who is long, and you get GEX — gamma exposure: an estimate of how much mechanical buying or selling a one-point move drags into the market.
Positive gamma damps. Negative gamma amplifies.
When dealers are net long gamma, their re-hedging leans against the move — they sell as price rises and buy as it falls. Moves shrink, ranges tighten, and heavy strikes behave like magnets. When dealers are net short gamma the same mechanics run in reverse: they buy strength and sell weakness, and moves extend. Neither state predicts direction. What changes is the character of movement — the same tape reads differently on either side of the line.
The three levels worth knowing
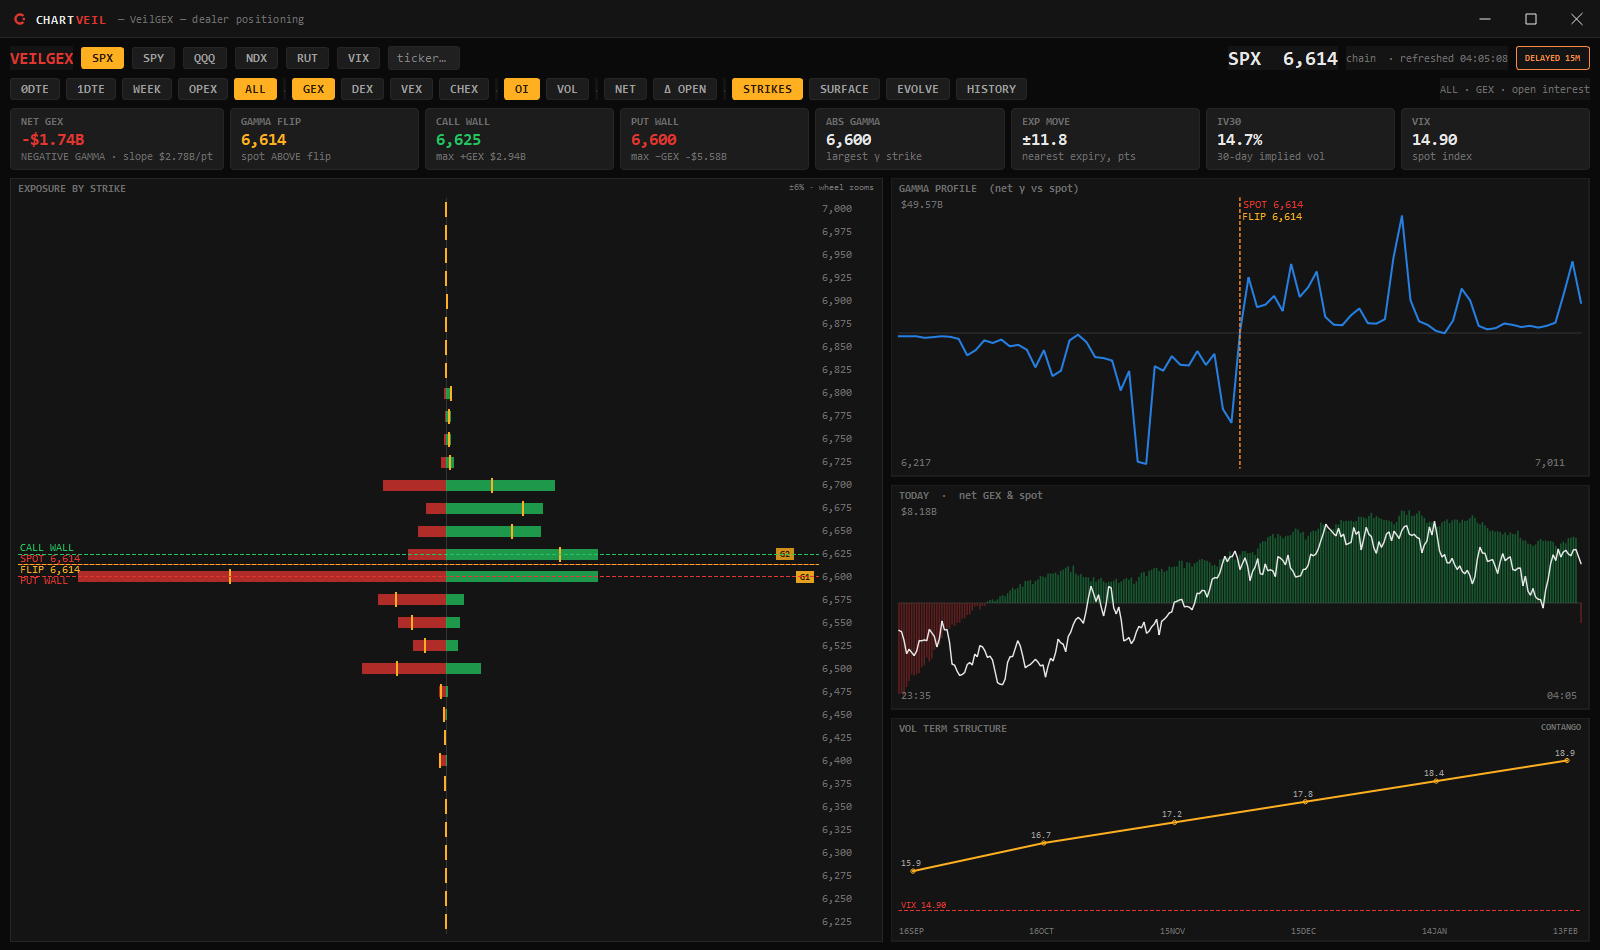
A GEX profile compresses into three levels a futures trader can actually use as context:
The zero-gamma flip — the price where net dealer gamma crosses zero. Above it, hedging tends to damp; below it, hedging tends to chase. Sessions that open on the negative side tend to travel further, in both directions.
The call wall — the strike carrying the heaviest positive exposure, usually above spot. Rallies into it often stall, not because anyone drew a line there but because hedging flow leans harder against price the closer it gets.
The put wall — the heaviest negative exposure below spot, the level where downside hedging pressure is concentrated and where breaks either stabilise or pick up speed.
Why futures traders care about an options number
NQ and ES track the same indices the options are written on, so the hedging flow lands in the products you trade. A wall is not support or resistance in the chart-pattern sense — it is a statement about whose orders are likely to show up if price gets there. Put a GEX level beside the order-flow read — does the book actually thicken into the wall? does aggression get absorbed there? — and each one sharpens the other. That is why VeilGEX draws positioning on a price axis rather than in a spreadsheet.
What GEX cannot do
GEX is computed from open interest and models, not from a registry of dealer inventory — it is an estimate, it is context, and it is one input among several. It does not say when, it does not say how far, and on some days positioning simply is not the story. Chartveil does not issue signals or advice; gamma exposure is a lens for your own read, not a substitute for one. See the risk disclosure.
Newsletter
Get updates, offers and events
New features, launch offers and live sessions, straight to your inbox. Unsubscribe any time.