A streak is a promise, not a fact
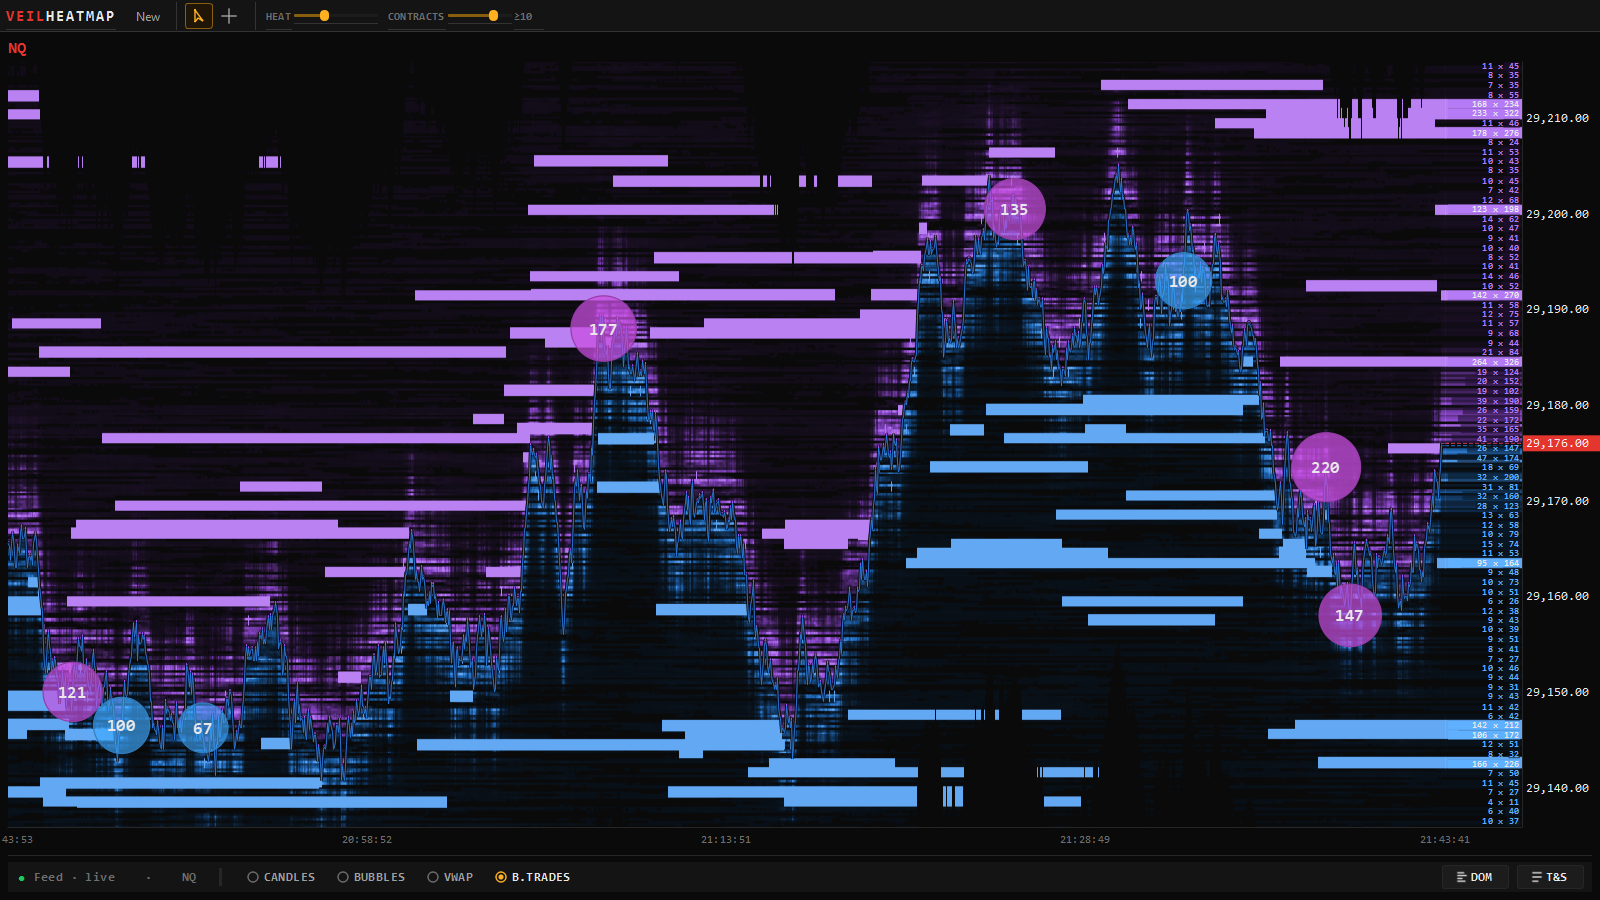
On a liquidity heatmap every price gets its own row and every snapshot its own column, newest on the right. Brightness is resting size. A level that holds size therefore draws a horizontal streak, and the streak grows for as long as the orders keep standing there.
That is the whole of what the picture records. It says a quantity is resting at a price right now. It does not say the quantity intends to trade.
When the streak ends, the size is no longer there. There are exactly two ways for size to leave a price: it gets filled, or it gets cancelled. Those two endings look identical on the heatmap on their own, and they mean opposite things. One is a level that took everything thrown at it. The other is a level that was never going to be filled.
The test is arithmetic, not intuition
The heatmap alone cannot separate the two endings, because it only reports resting orders. The separation comes from putting the resting side next to the executed side and doing one subtraction.
Take an ask level on NQ at 20,142.00. The ladder reads 480 contracts total. Over the next four minutes the streak stays bright and price grinds up underneath it. Then the streak ends.
Ask what traded at that price while it ended. Two very different answers are possible.
In the first, the footprint shows 511 contracts lifting the ask at 20,142.00 in that window. Resting size fell by 480, executed volume was 511, and the two numbers agree within the size that arrived and refilled along the way. Nothing was cancelled. Somebody stood there and sold everything that came, and the streak ended because the inventory ran out. That is absorption, and it is the expensive kind of level to lean against.
In the second, the same 480 goes to 40, and the footprint shows 14 contracts traded at that price in the same seconds. Resting size fell by 440. Executed volume accounts for 14 of them. The other 426 were cancelled, in a book that had just been approached and not yet hit. That streak did not fail. It withdrew.
The subtraction is the whole method: size that disappeared, minus volume that printed at that price, is size that was cancelled. A level where those two numbers are close was traded through. A level where the gap is most of the wall was pulled.
Three endings, not two
Once you start doing the subtraction, a third shape appears, and it is the most common of the three.
A level shows 300 contracts. Volume pours through it — 200, then 400, then 700 contracts hitting that price — and the ladder keeps reading somewhere around 300 the whole time. Size that disappeared is roughly zero. Executed volume is 1,300. The wall is being refilled as fast as it is consumed.
That is not the same as the first case. Absorption that runs out is a finite quantity meeting more aggression than it expected. Replenishment is a participant deciding, repeatedly, to keep standing at a price. Both hold price, and they end differently: the finite wall ends when it is exhausted, the replenished one ends when whoever is refilling it stops choosing to. Nothing on the chart announces that decision in advance.
So the three readings are: consumed, refilled, withdrawn. The heatmap draws all three as a streak that ends. Only the executed side tells you which one you watched.
Biggest x total narrows it further
There is a second reading that costs nothing and sharpens the first. A market-by-order feed carries individual resting orders rather than one aggregate per price, which is what lets the DOM ladder print the largest single order beside the level total.
Two levels both read 480. One is 310 x 480: a single 310-contract order plus some company. The other is 38 x 480: roughly forty orders in the low teens, standing side by side.
Those two behave nothing alike when price arrives. The 310 can leave in one cancel — one participant, one decision, gone between snapshots, which is why a pulled wall so often ends in a single vertical edge on the map rather than fading. The 38 x 480 has to be dismantled by forty separate decisions, so it usually decays across several snapshots even when every one of them is retreating. A crowd is slower than a person.
None of that proves what any order was for. It changes what you should expect the ending to look like, which changes how much a clean vertical edge ought to surprise you.
What the misread actually costs
The reason to be careful here is that the two readings point opposite ways, so getting them backwards is not a neutral error.
Suppose you read a wall as real, and you take the move you expect it to stop. Four NQ contracts, and price runs twelve ticks past where you thought the level would hold before you are out. NQ is $5 a tick, so twelve ticks on four contracts is $240 — on a level whose defence was cancelled in one message while you were still deciding.
Now the other way. You read absorption as a pull, leave a position that a genuine seller was defending, and price never comes back through. There is no receipt for that one. It shows up in a journal as a small win that should have been larger, which is exactly the kind of error that survives review.
The heatmap makes both mistakes visible after the fact, and only after the fact. That is not a flaw in the tool. Resting liquidity is a statement of intent, and intent is revocable.
What none of this tells you
It does not tell you why. A cancelled wall has many ordinary explanations: a hedge being re-priced as the underlying moves, a quoting participant widening ahead of a number, an order pulled because the position behind it was filled somewhere else, a firm stepping back from a market that got faster than its risk allows. Withdrawing resting size is normal behaviour in an electronic book and most of it is entirely legitimate.
The glossary has a short entry for the pattern, and it is worth being precise about the word. Spoofing is a legal finding about intent, made by regulators with access to order records, account identities and messaging history that no chart contains. What you can observe is a shape: size that appeared, attracted, and left without trading. Calling that shape by the name of a crime is a claim your screen cannot support.
Nor is any of this a setup. Knowing that a wall was pulled tells you what happened at one price in the past few seconds. It does not say where price goes next, it does not say whether the pull was the start of something, and on plenty of days the resting book is simply not where the session is being decided. The help centre covers how each panel is read, and the risk disclosure says the rest plainly: order-flow tools describe the market, they do not forecast it, and no reading of them makes a losing trade less possible.
Newsletter
Get updates, offers and events
New features, launch offers and live sessions, straight to your inbox. Unsubscribe any time.