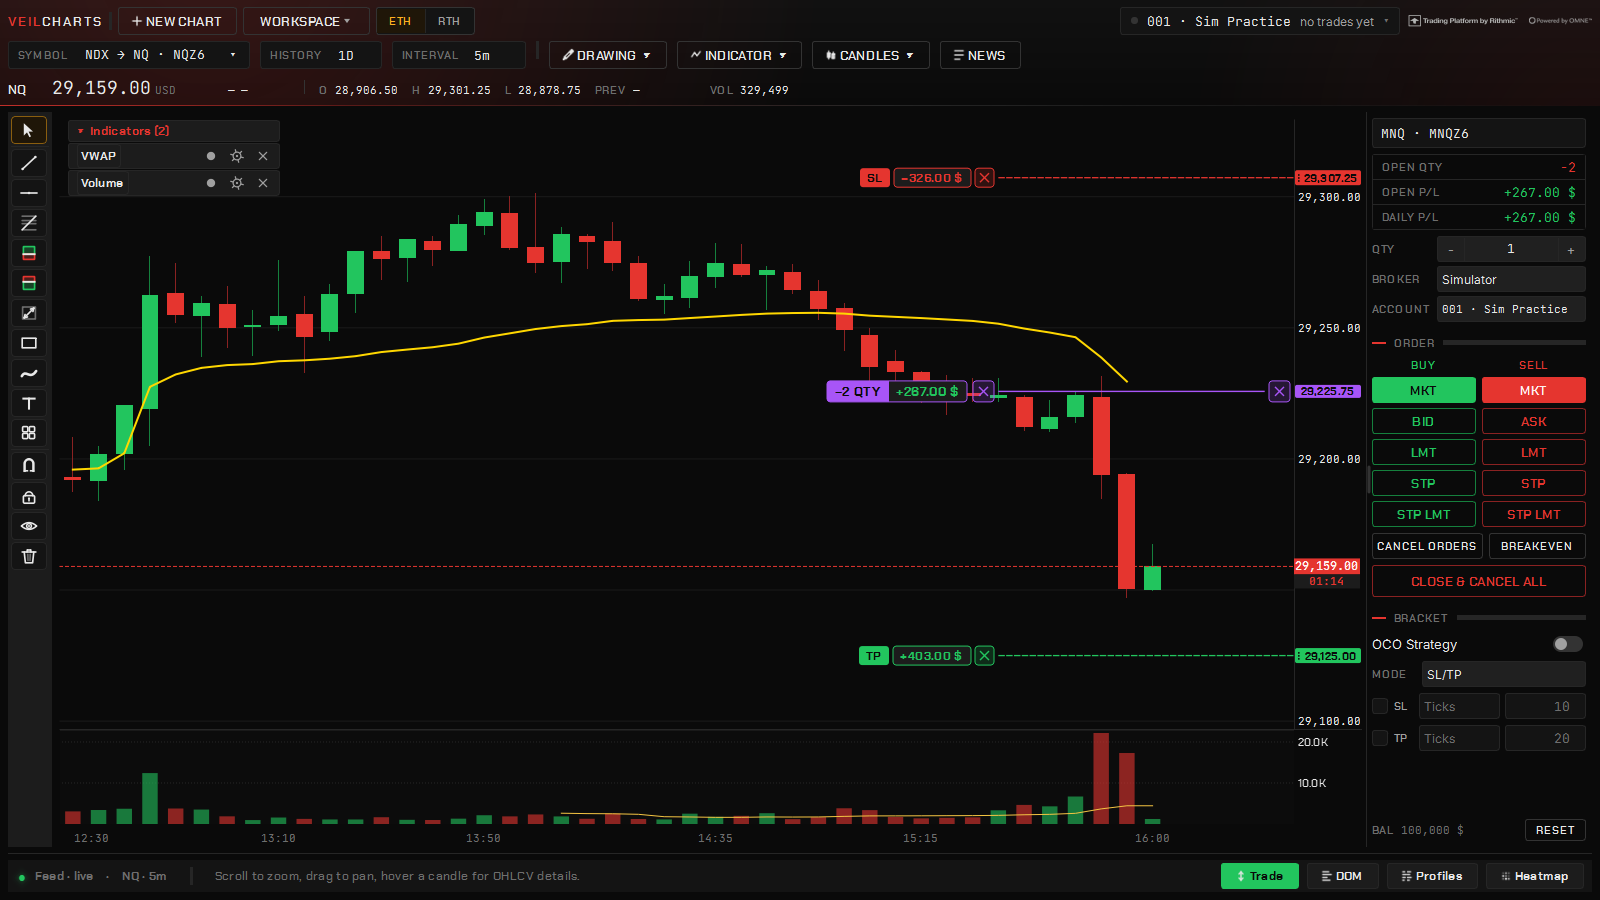
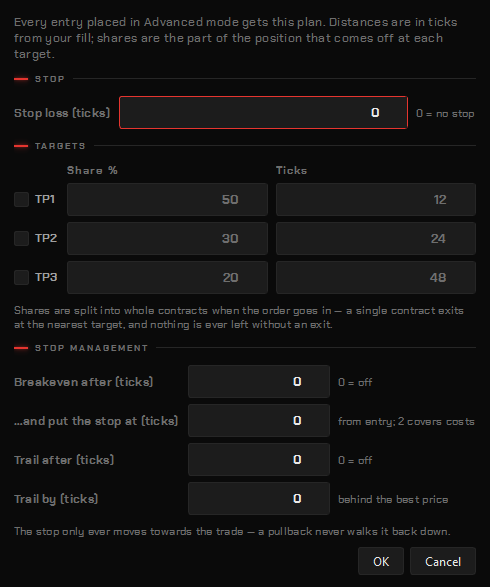
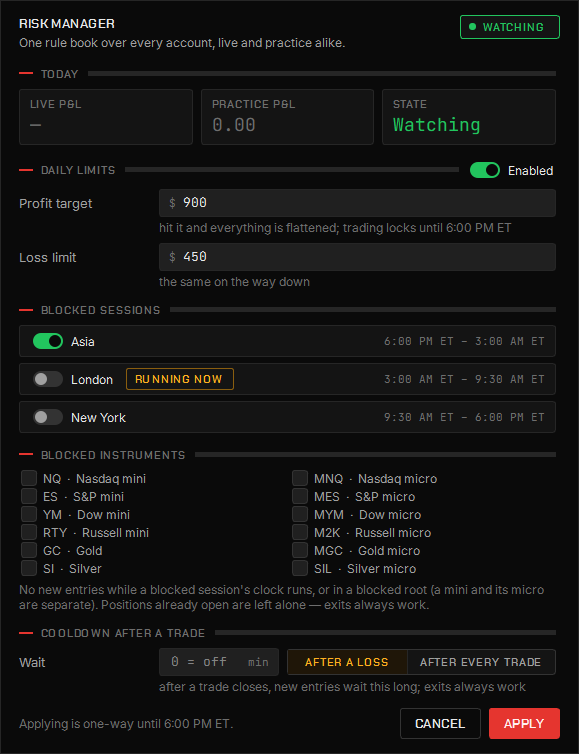
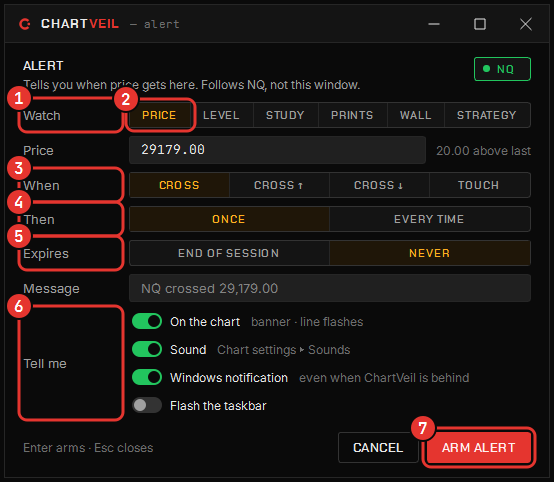
What the platform is, what it is not, and how this manual is laid out.
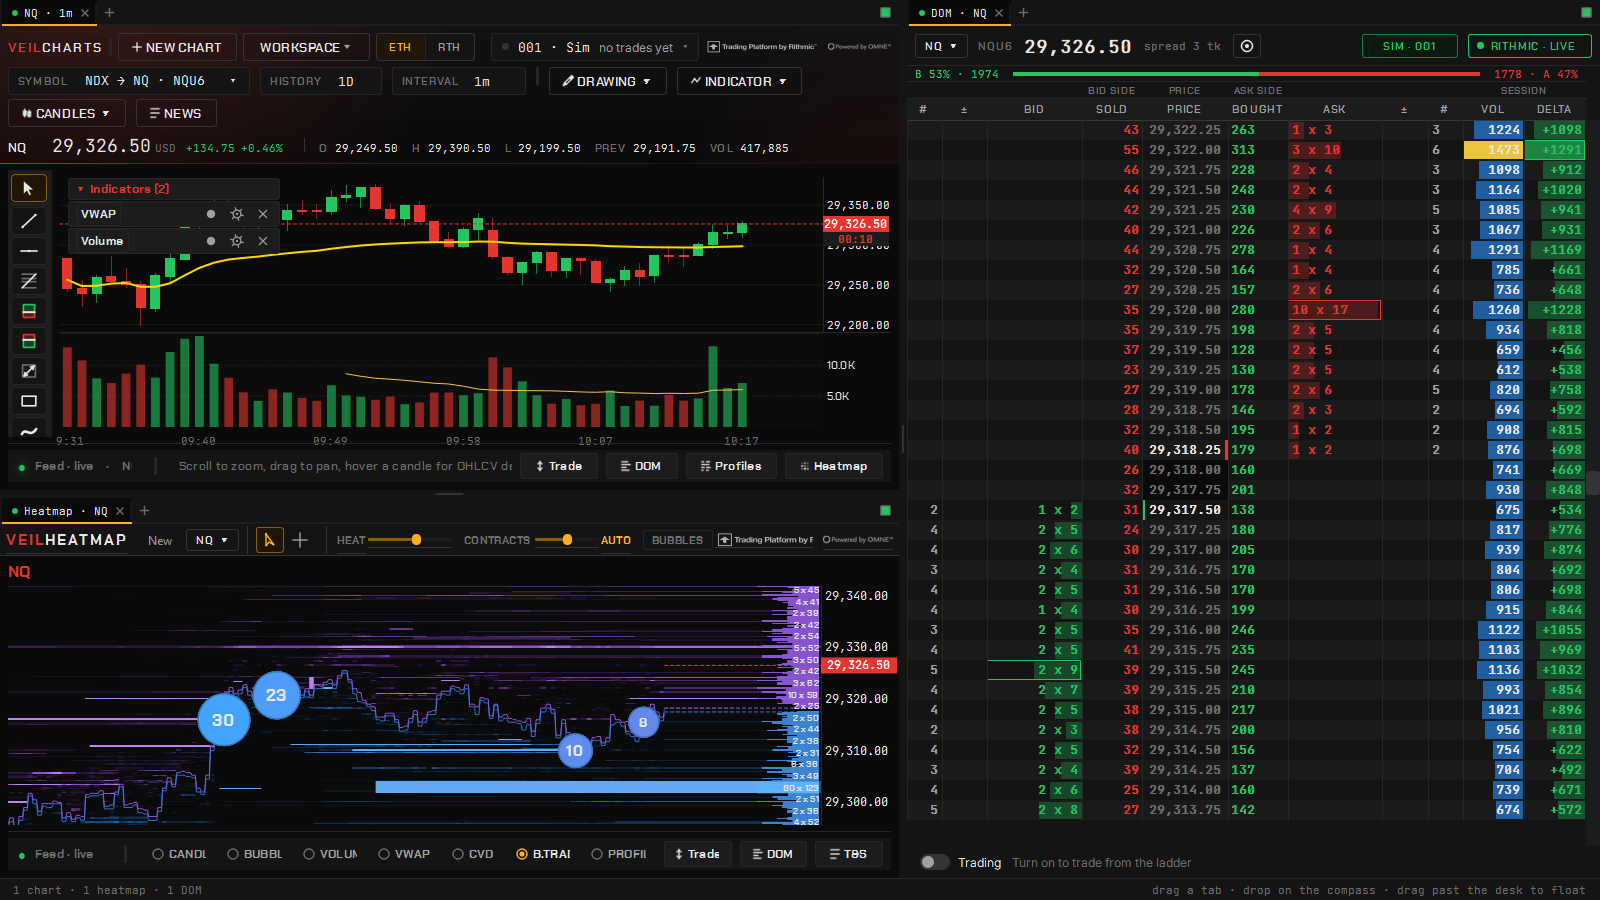
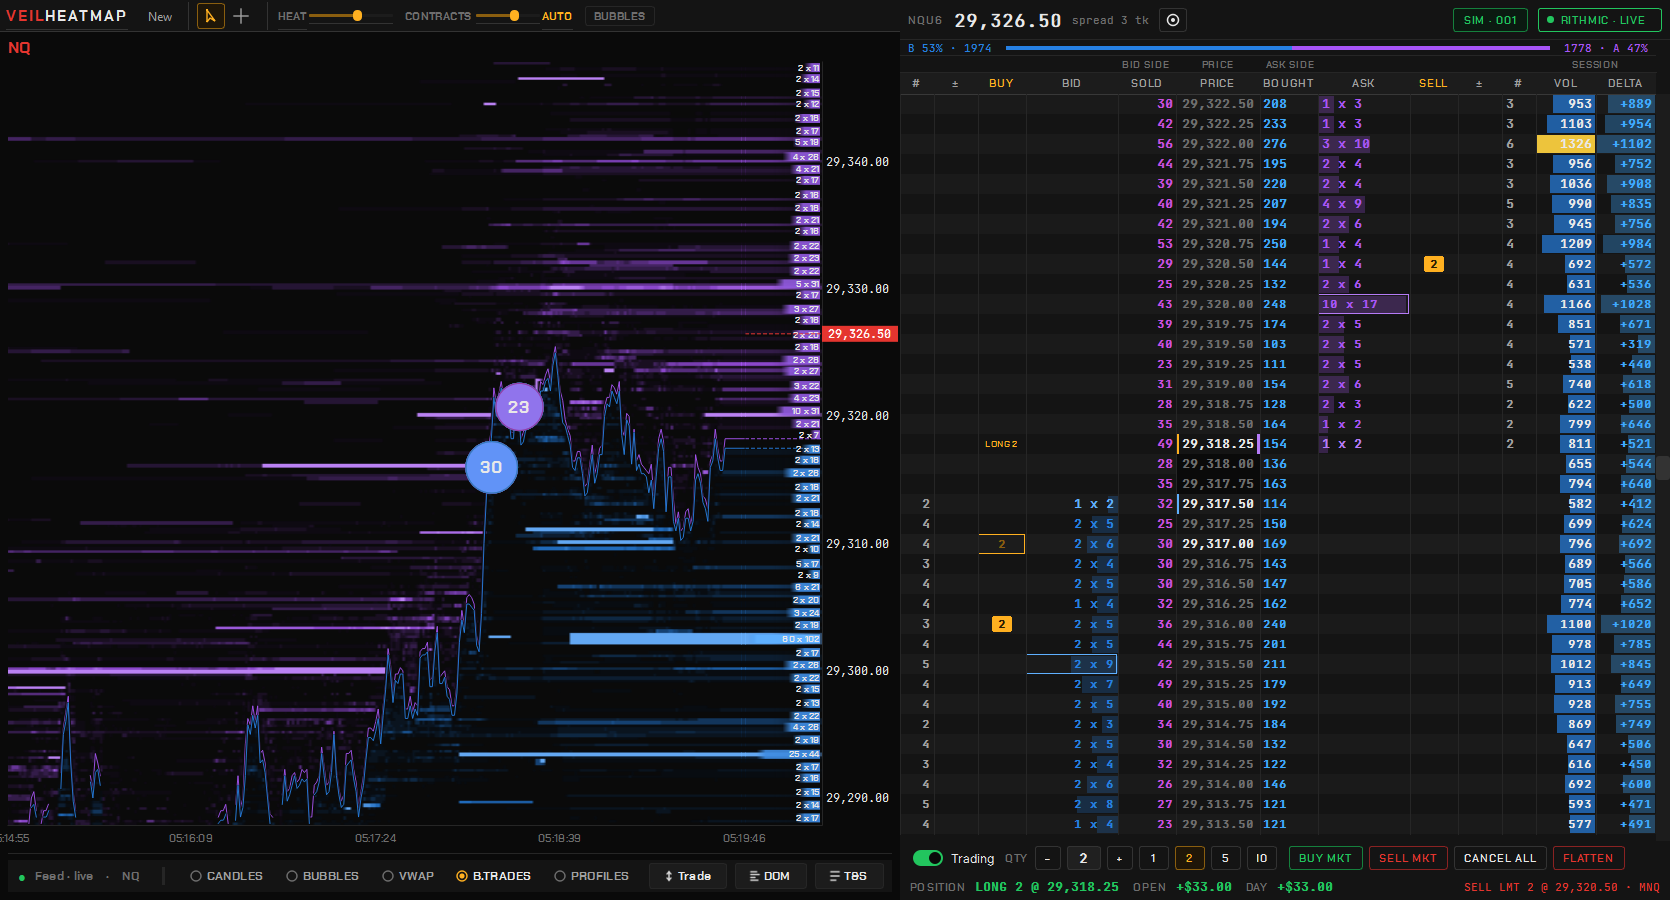
The Veil Desk with a chart, a liquidity heatmap and the ladder docked in one window Real NQ tape, recorded through Rithmic in September 2026 — shown to illustrate the software, not a forecast or a trading recommendation. Chartveil does not provide or resell market data.
Chartveil is a desktop order-flow terminal for index futures. It puts a liquidity heatmap, a footprint, a depth ladder and volume and delta profiles on one shared tape, so every panel is describing the same instant in the book. You can trade from the chart and the ladder on your own prop-firm or broker account, rehearse on a built-in simulator, automate a strategy you wrote yourself, and keep an honest record of all of it in the journal.
It runs natively on Windows and connects to the market through the Rithmic data login your firm issues. Chartveil does not provide market data itself, is not a broker, holds no funds, and does not give advice. Every order sent from the platform is placed on your instruction, into your account, through your firm.
Who this manual is for
Anyone with a subscription and a Windows PC. It assumes you can read a candle chart and nothing more: the order-flow chapters explain the panels from first principles, and the glossary defines every term the platform uses.
If you only ever look at candles, that is fine. The charting, the drawing tools, the profiles and the standard indicators stand on their own; the heatmap and the ladder are there when you want them.
How the book is organized
Part
What it covers
Start here
Requirements, installing, activating, connecting your feed, the Command Center.
The desk
Charts and bar types, tabs, the Veil Desk, workspaces, drawings, the global crosshair.
Order flow
The liquidity heatmap, Veil Print, the advanced DOM, Time & Sales, the profiles.
Studies
Adding and managing studies, the Veil studies, the standard indicators.
Dealer positioning
VeilGEX and the gamma studies on the chart.
Trading
Accounts and the simulator, the ticket, ladder trading, exits and sizing, the Risk Manager, alerts, the copier.
Automation
The Strategy Studio and the Auto Trader.
Record & assistant
The journal, News and the economic calendar, Veil AI.
Reference
Shortcuts, files and updates, troubleshooting, the glossary, account and billing.
Read Start here in order; the rest can be read in any order. Every chapter stands alone and links where it depends on another.
Conventions
Menu paths are written with arrows: right-click → Chart settings… → Sounds.
Keys look like this: Ctrl+,.
Names on screen — buttons, chips, tabs — are set in bold: press Connect Feed.
Instruments are named by their exchange symbol: NQ, ES, YM, RTY, GC, SI and the micros MNQ, MES, MYM, M2K, MGC, SIL. Sizes are always in contracts.
Times are ET (New York) unless the text says otherwise, because that is the clock the exchange keeps.
Note
Callouts like this one carry something worth knowing before you go on. A Warning callout marks a rule that protects an account; read those twice.
What Chartveil will never do
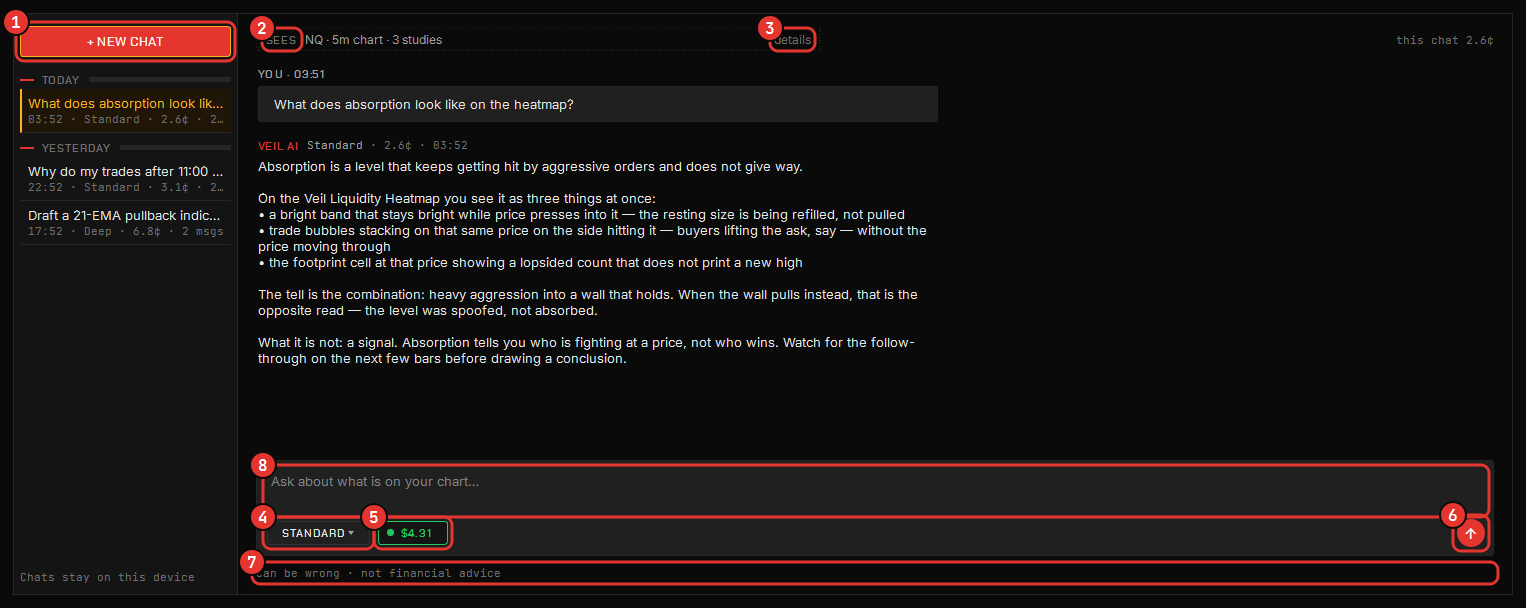
It never places an order you did not ask for, never changes a setting behind your back, never sends your feed password anywhere, and never tells you which way to trade. Veil AI, the built-in assistant, explains and drafts; it cannot reach your orders, your Risk Manager or your account.
Where to get help
The Help Center on the site answers the questions this manual gets asked most.
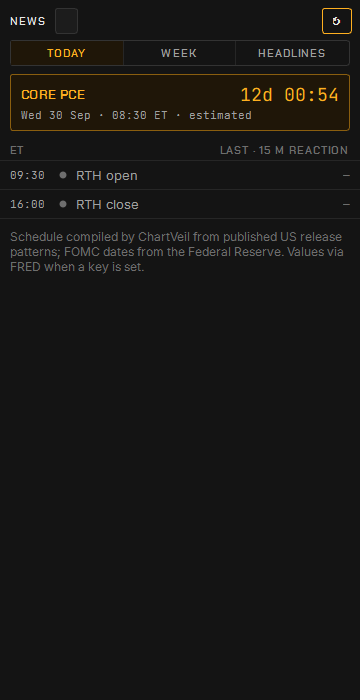
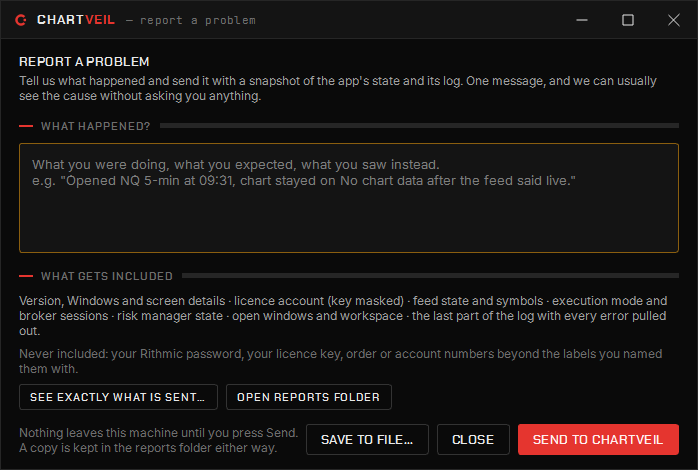
Help → Report a problem… in the Command Center builds a snapshot of the version, feed, accounts and log and lets you see byte for byte what leaves before you send it. See Troubleshooting.
Discord is where the quickest answers happen; the invite is on the contact page.
Start here
Requirements & installation
What you need before the first launch, and how the installer behaves.
What you need
Five things, and four of them are yours to sort out before any money changes hands:
A Windows 10 or 11 PC (64-bit) that meets the requirements below. There is no macOS or web build yet; both are in development and your subscription will cover them when they ship.
A Rithmic data login issued by your prop firm or broker. Chartveil does not provide market data; you sign in with the credentials your firm gives you. Not every firm issues them — ask yours “do you provide Rithmic login credentials, with Level 2?”
Level 2 on that login if you want the heatmap and the ladder. Charts, footprints and profiles work without it; the depth panels do not.
Your firm’s permission to trade through a third-party platform, if you intend to place orders from Chartveil on a funded account. Analysing is rarely restricted; executing sometimes is.
A wired connection. Market-by-order is a heavy stream and Wi-Fi shows up as gaps in the book.
You must also be 18 or older. Everything else — the terminal, every panel, every update — comes with the subscription; nothing is an add-on.
System requirements
Recommendation
Operating system
Windows 10 or 11, 64-bit
Memory
8 GB to 16 GB — toward 16 GB if you run several heatmap windows alongside charts
Display
1920×1080 or better; the panels are dense by design. Any number of monitors.
Network
Wired. A flaky link shows up as gaps in the book.
Disk
Grows with recorded tick history — allow for it if you intend to backtest
Some traders run Windows in a virtual machine on a Mac. That configuration is untested and unsupported: a per-tick heatmap is exactly the workload a virtual display struggles with.
Level 2, per exchange
Level 2 is entitled per exchange on your Rithmic subscription. A CME entitlement covers NQ, ES and RTY; YM trades on CBOT, and GC and SI on COMEX, so each needs its own Level 2 line before its depth panels fill. The heatmap’s instrument menu says no depth beside a market your entitlement does not cover.
Getting the installer
The installer goes to subscribers — there is no public download. Start a subscription and the Windows build appears on your dashboard, next to your licence key. Each download is personalised to the account that takes it, so keep it to yourself; the licence agreement covers what sharing it would mean.
Two builds are on offer from the dashboard’s Download tab:
Stable — the one to trade on.
Beta, when there is one — every feature and fix first, and the least time in front of customers.
Both install to the same place, so running either installer switches you to that build, and one licence covers both.
Running the installer
Download the installer from the dashboard and run it.
The build is not code-signed yet, so Windows SmartScreen will warn on first run. Click More info, then Run anyway. Only do that for an installer you downloaded from your own dashboard — that is the only place it is published.
It installs per-user and needs no administrator rights.
Note
Some antivirus products quarantine unsigned installers on the same grounds. Restore the file and allow it, or download again after adding an exception. Signing is on the list and the warning goes away when it lands.
Downloading during the exchange’s maintenance break (17:00–18:00 ET) is fine; the feed simply reads connecting… until the market reopens.
Several machines
Install it on as many of your own computers as you like. What the plan limits is how many copies run at the same time — one on Veil Chart, one on Veil Flow (two on annual), three on Veil Stack. If a copy is already open elsewhere, the new one tells you which machine has it and offers to take the seat over in one click. See Files, updates & seats.
Uninstalling
Remove it from Windows’ Installed apps like any other program. Your settings, workspaces and journal in %LOCALAPPDATA%\Chartveil are left in place on purpose, so reinstalling later brings your desk back; delete that folder yourself if you want a clean slate. Uninstalling does not cancel the subscription — that is done from the billing portal.
Start here
First run
Activate the build, connect your feed, open one chart, and set two things up before you ever trade.
1. Activate
On first launch the terminal asks for the email and licence key shown on your dashboard. That activates the build and takes a seat on your plan. The terminal signs in once and then stays signed in; the licence checks in with us each time it opens, and if our server cannot be reached the build keeps working for two weeks on the last successful check before it asks again.
If the key is refused or it says the seat is in use, see Troubleshooting.
2. Connect your feed
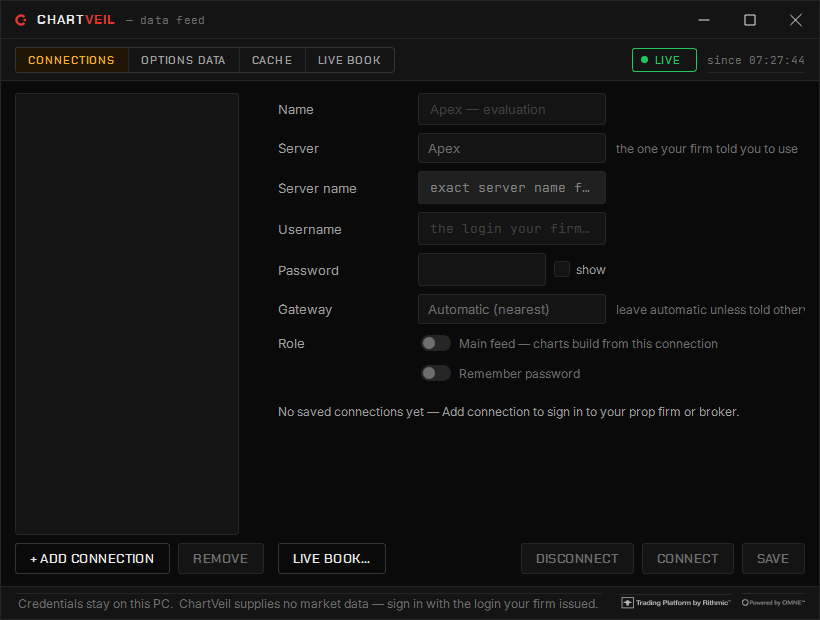
The Data feed dialog: a saved connection is your firm’s server, the data login it issued, and whether it is the main feed.
Open the Command Center — it is the window that opens first.
Press Connect Feed.
Pick your server — your prop firm’s by name, or paper trading.
Enter the username and password your firm issued for market data. That is all the dialog asks.
Optionally tick save the login. The password is stored sealed to your Windows account and never leaves your machine for ours. Leave it unticked and you type it each session.
The status chip tells the truth: during the exchange’s daily maintenance break (17:00–18:00 ET) it reads connecting… because the market is closed, not because anything is wrong.
Warning
The dialog wants the Rithmic data login your firm issued, which is usually different from the login for the firm’s own website. A funded login on the paper-trading server, or the other way round, is refused. We will never ask you for your feed password — a message that does is not from us.
3. Open one chart
From the Command Center open one chart and one heatmap on the same instrument. Arrange them, then save the workspace from the chart’s workspace menu — it will come back exactly as you left it at the next launch. That is the whole platform running.
If the chart draws and the heatmap stays empty, your login is missing Level 2 — see Requirements.
4. Before you trade
Two more things, both a minute’s work and both cheaper than learning the ticket live:
Open a simulated account and place a few trades there. The simulator runs the same ticket, the same chart trading and the same rules on live prices. See Accounts & the simulator.
Set the Risk Manager’s daily loss limit from the Command Center’s Risk menu. Once applied it cannot be raised until the next trade window, which is the point. See The Risk Manager.
Where things are
You want to
Go to
Open a chart, heatmap, ladder or any tool
The Command Center tiles
Connect or change the feed
Command Center → Connect Feed
Change chart colours, sounds, windows, data
Right-click a chart → Chart settings… (Ctrl+,)
Set the daily loss limit
Command Center → Risk
Add a study
The Indicator ▾ button in the chart header
Save or share a layout
The chart’s workspace menu
Report a problem
Command Center → Help → Report a problem…
What happens at the next launch
Whatever was connected when you closed the platform — the chart feed and your broker sessions — reconnects, the last-opened workspace restores on the same monitors, alerts re-arm, and the journal catches itself up on the fills it missed. The terminal also checks for a newer stable build before it opens; see Files, updates & seats.
Start here
The Command Center
The launch window — every tool opens from here, the feed and the Risk Manager report here, and closing it exits the platform.
The Command Center is the first window to open and the last to close. Charts, heatmaps, the Veil Desk and every other tool launch from its tiles; the feed chip, the Risk Manager chip and a live CME session clock sit in its frame.
Note
Closing the Command Center exits the application. Closing a chart window does not stop the feed.
The tiles
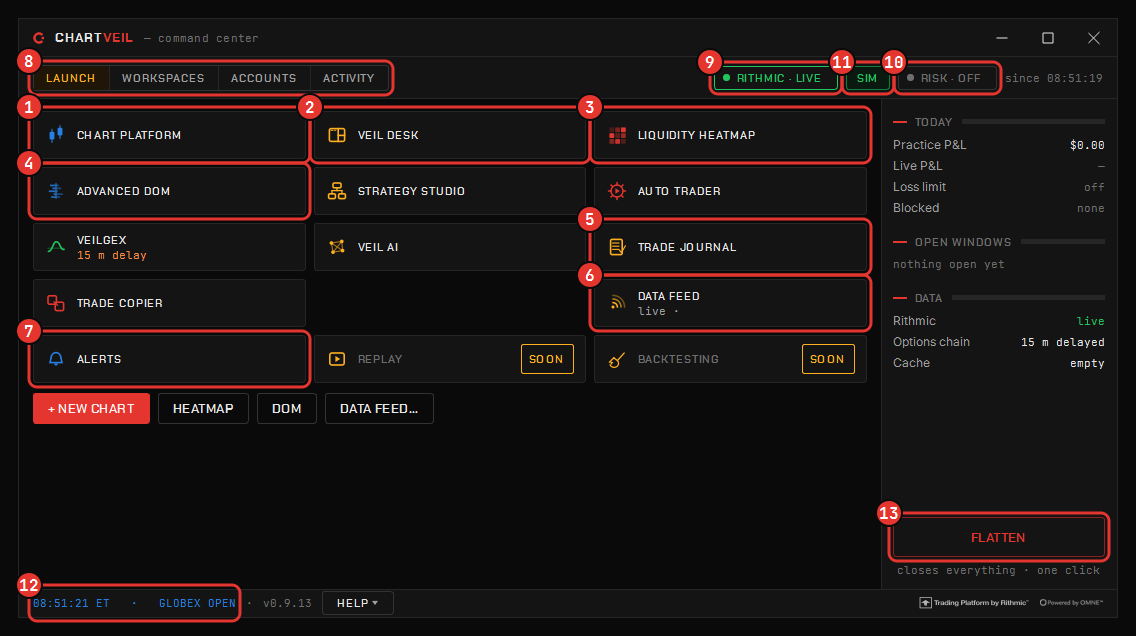
The Command Center. 1 Chart platform · 2 Veil Desk · 3 Liquidity heatmap · 4 Advanced DOM · 5 Trade journal · 6 Data feed · 7 Alerts · 8 the Launch, Workspaces, Accounts and Activity tabs · 9 feed chip · 10 Risk chip · 11 SIM / LIVE badge · 12 session clock · 13 FLATTEN.
A tile’s second line is live status only — how many windows are open, which account the feed is on, a delayed options chain, the Auto Trader armed — and its description is in the tooltip. Click a tile to open the tool; right-click a tool’s tile to choose between opening it in the desk or in a window.
Tile
Opens
Chart platform
The main chart window — NQ, ES, YM, RTY, gold, silver; every study, the DOM and the trading panel. See Charts.
Order-by-order resting liquidity. Opens with no instrument; pick it on the window’s chip. See Liquidity Heatmap.
Advanced DOM
The depth ladder in its own window. Opens unassigned as well. See Advanced DOM.
Strategy Studio
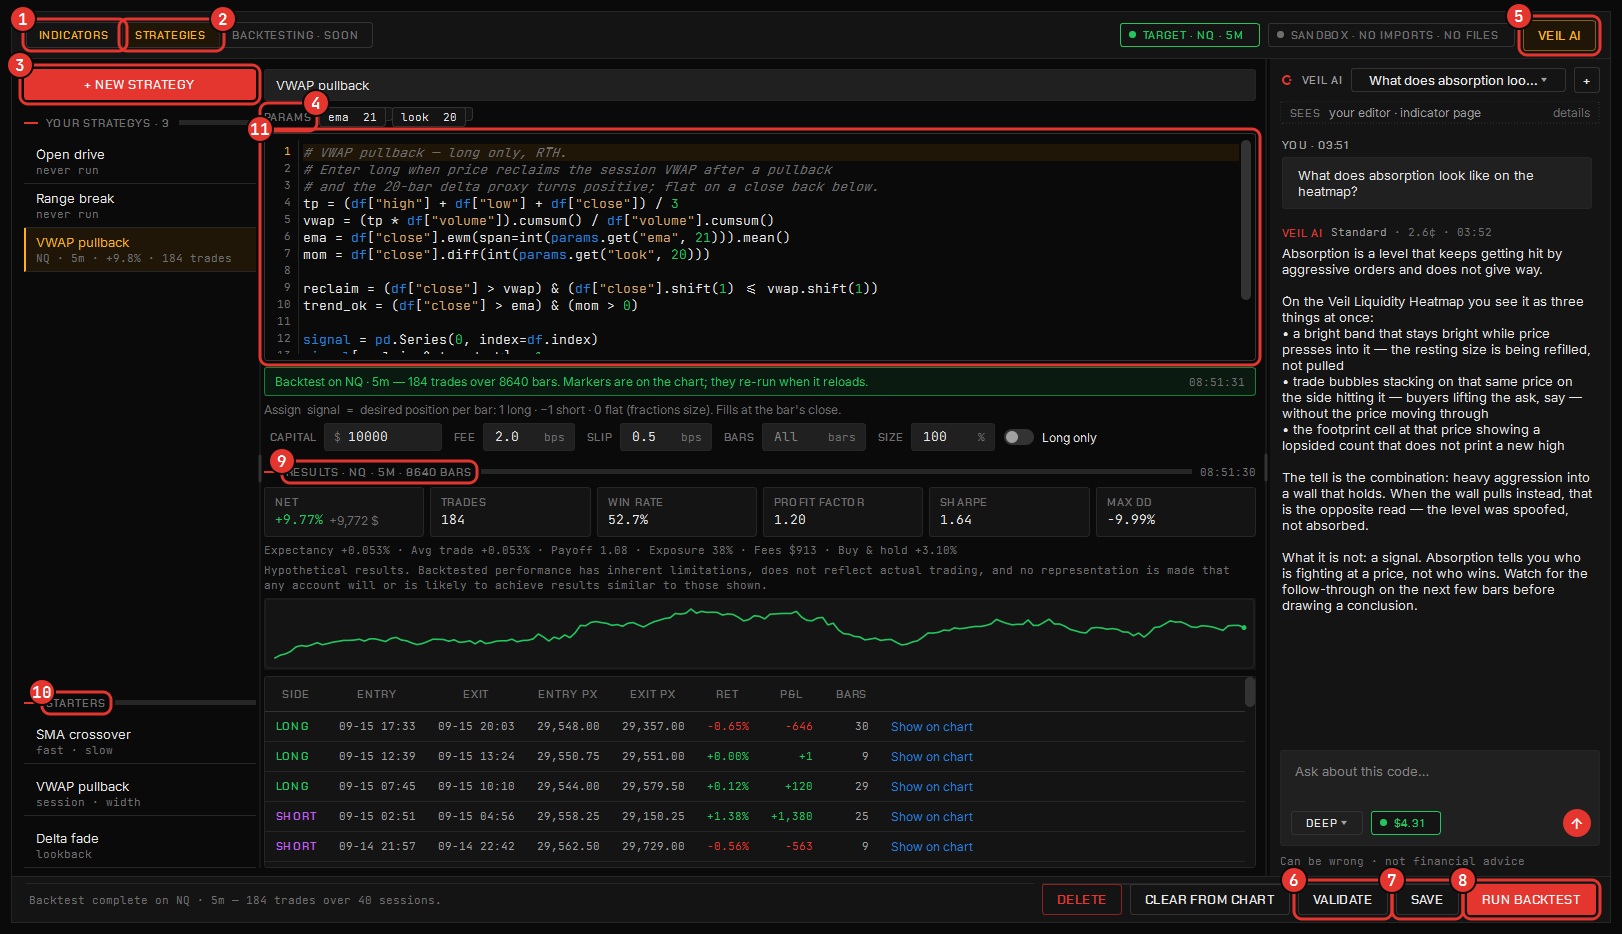
Your own indicators and strategies in sandboxed Python. See Strategy Studio.
Auto Trader
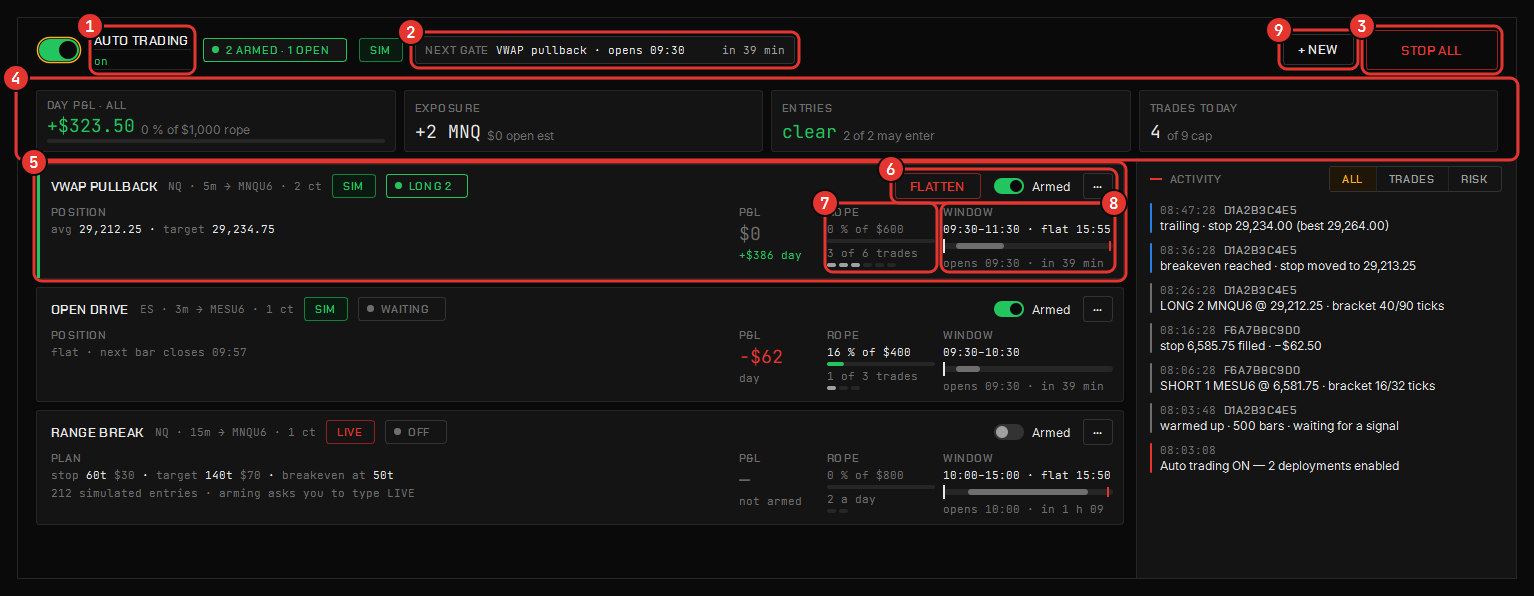
Deploy a Studio strategy to trade its own signals. See Auto Trader.
VeilGEX
Dealer gamma by strike on SPX and NDX. See VeilGEX.
Veil AI
The assistant; every conversation is saved locally. See Veil AI.
Trade journal
Every fill journaled automatically. See Trade Journal.
Trade copier
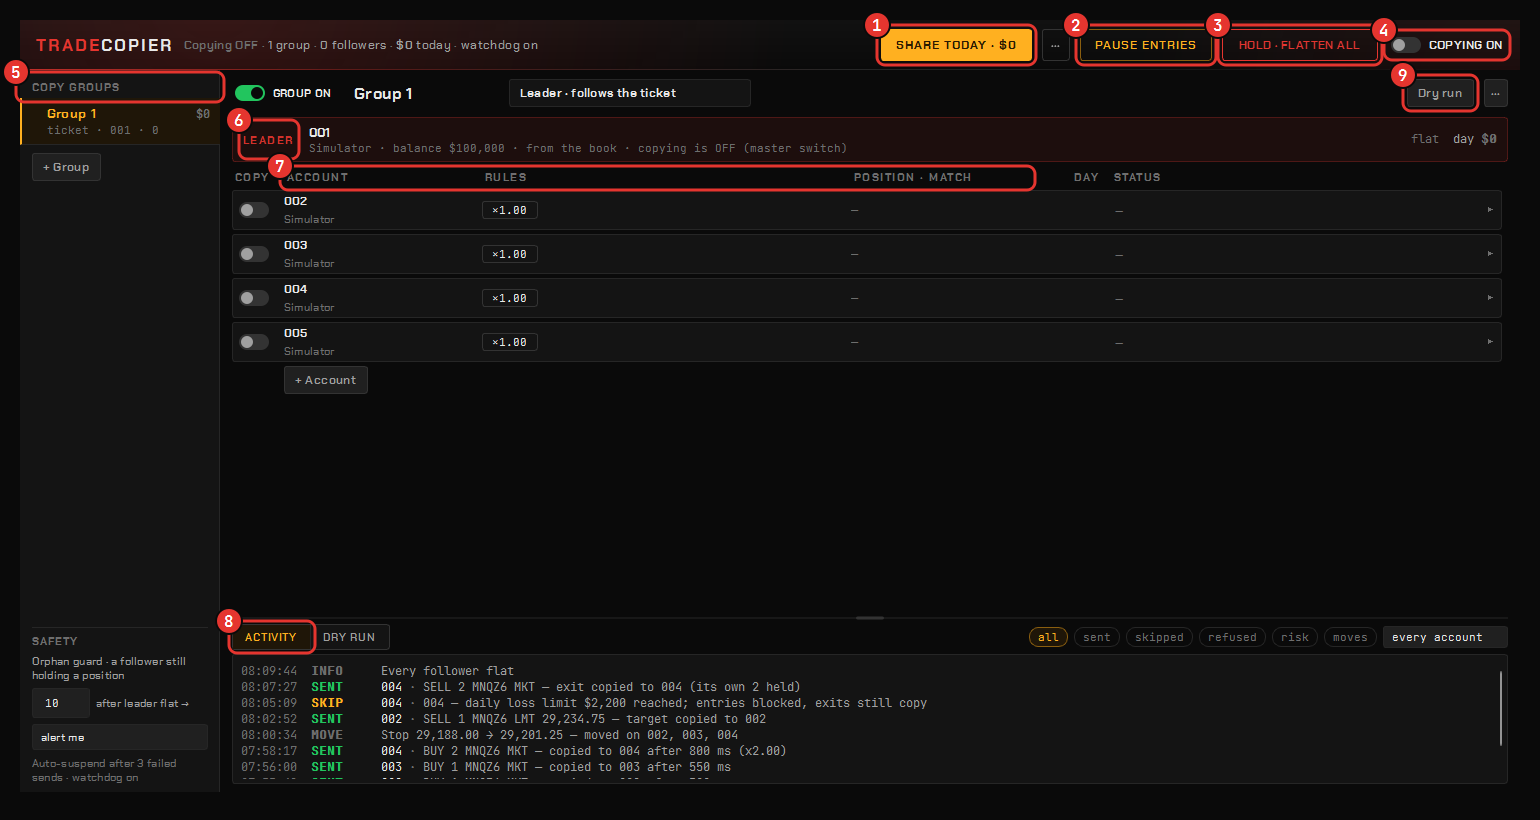
Mirror one account’s orders on the others you own. See Trade Copier.
Data feed
Your saved connections, which one connects on startup, the options-chain key, the cache.
Alerts
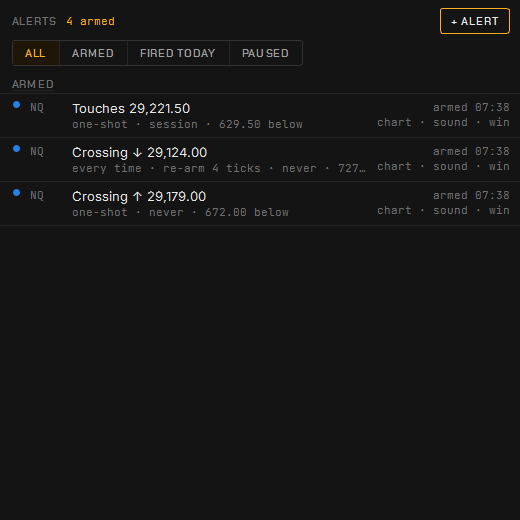
Every alert you have armed and what fired today. See Alerts.
Dimmed tiles are on the way — they do not launch, they say when they will.
The tabs
Launch — the tiles above.
Workspaces — your saved layouts, to open, rename or delete; and Import a shared workspace…. See Workspaces.
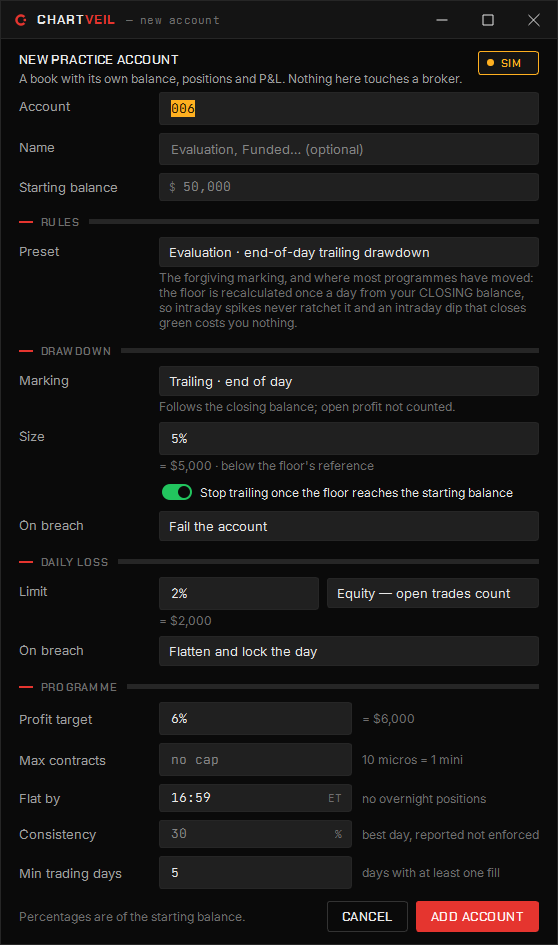
Accounts — the broker accounts and simulated accounts the platform knows about, with their rule sets. See Accounts & the simulator.
Activity — every window that is open right now, and what it is doing.
The frame
Feed chip — offline, connecting or live, with the account the feed is on. During the exchange’s maintenance break (17:00–18:00 ET) it reads connecting… because the market is closed.
Risk chip — watching, cooldown or off; click it for the rule book and today’s numbers. See The Risk Manager.
Risk menu — where the daily limits, session blocks, blocked instruments and cooldown are set.
Help — the manual, the Help Center, About, and Report a problem…, which builds a diagnostic snapshot you can read before you send it. See Troubleshooting.
Session clock — which CME session is open and how long it has left, in the footer.
Connect Feed
Connect Feed opens the sign-in: pick your firm’s server by name (or paper trading), enter the data username and password your firm issued, and optionally save the login. The password is sealed with Windows’ own data protection so only your Windows account can read it back, and it never leaves your machine for ours. Full steps in First run.
The Data feed tile is the longer form of the same thing: several saved connections, which one connects at startup, your own options-data key if you have one, and the tick cache.
Running several instruments
Windows are per-instrument and the Command Center launches as many as your machine will carry — as tabs in one chart window, as tiles on a desk, or as windows across your monitors. Each heatmap window is decoding depth, so count those first if the machine starts to labour.
The desk
Charts
The chart window — bar types built from ticks, the header, moving around, colours and appearance, and what to do when a chart looks wrong.
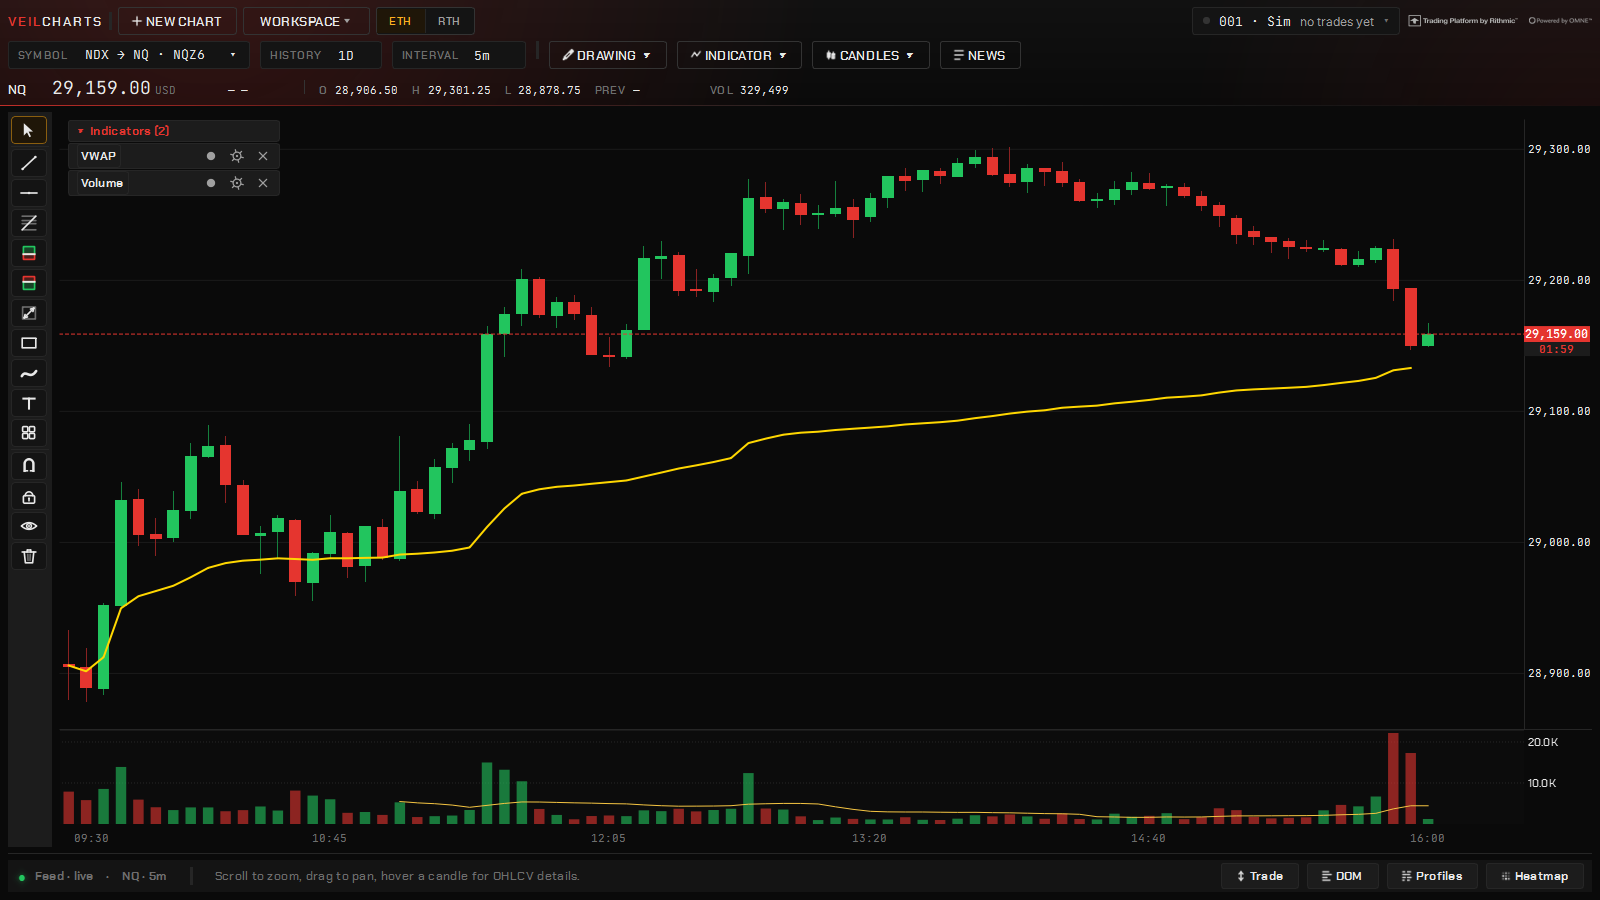
A 5-minute NQ chart with the session VWAP and volume — the whole regular session in view Real NQ tape, recorded through Rithmic in September 2026 — shown to illustrate the software, not a forecast or a trading recommendation. Chartveil does not provide or resell market data.
The chart is where the order flow sits. Every bar type is built trade by trade from raw stored ticks, six markets are one chip away, and the same window carries the studies, the drawings, the order ticket and your position.
The header
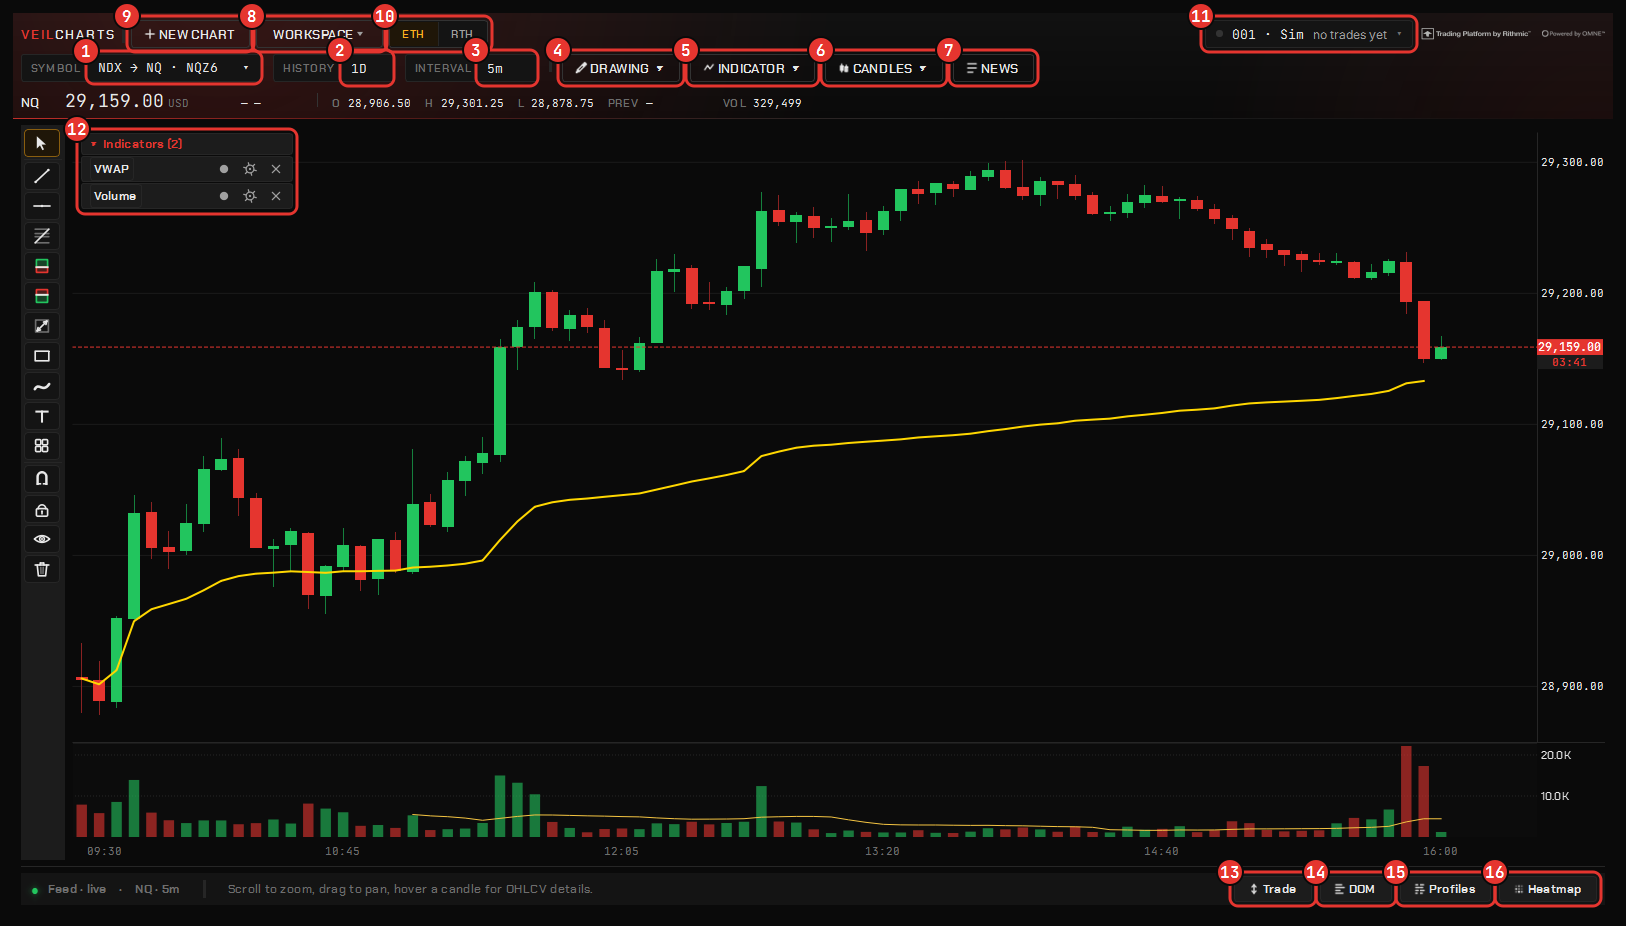
The chart window. 1 instrument chip · 2 History · 3 Interval / size · 4 Drawing · 5 Indicator · 6 chart type · 7 News · 8 Workspace · 9 New chart · 10 ETH / RTH · 11 account chip · 12 the legend · 13 Trade (the ticket) · 14 DOM · 15 Profiles dock · 16 Heatmap. Real NQ tape, recorded through Rithmic in September 2026 — shown to illustrate the software, not a forecast or a trading recommendation. Chartveil does not provide or resell market data.
From left to right:
Instrument chip — the contract on this chart. Click it to switch market or contract month. Chart NQ and trade MNQ if you like; the position draws on the chart you are watching. See The order ticket.
Interval / size box — 5m, 1h, or the size of a non-time bar: on a range chart it reads RANGE and the number is the bar’s size in ticks.
Chart type — candles, and the non-time bars described below.
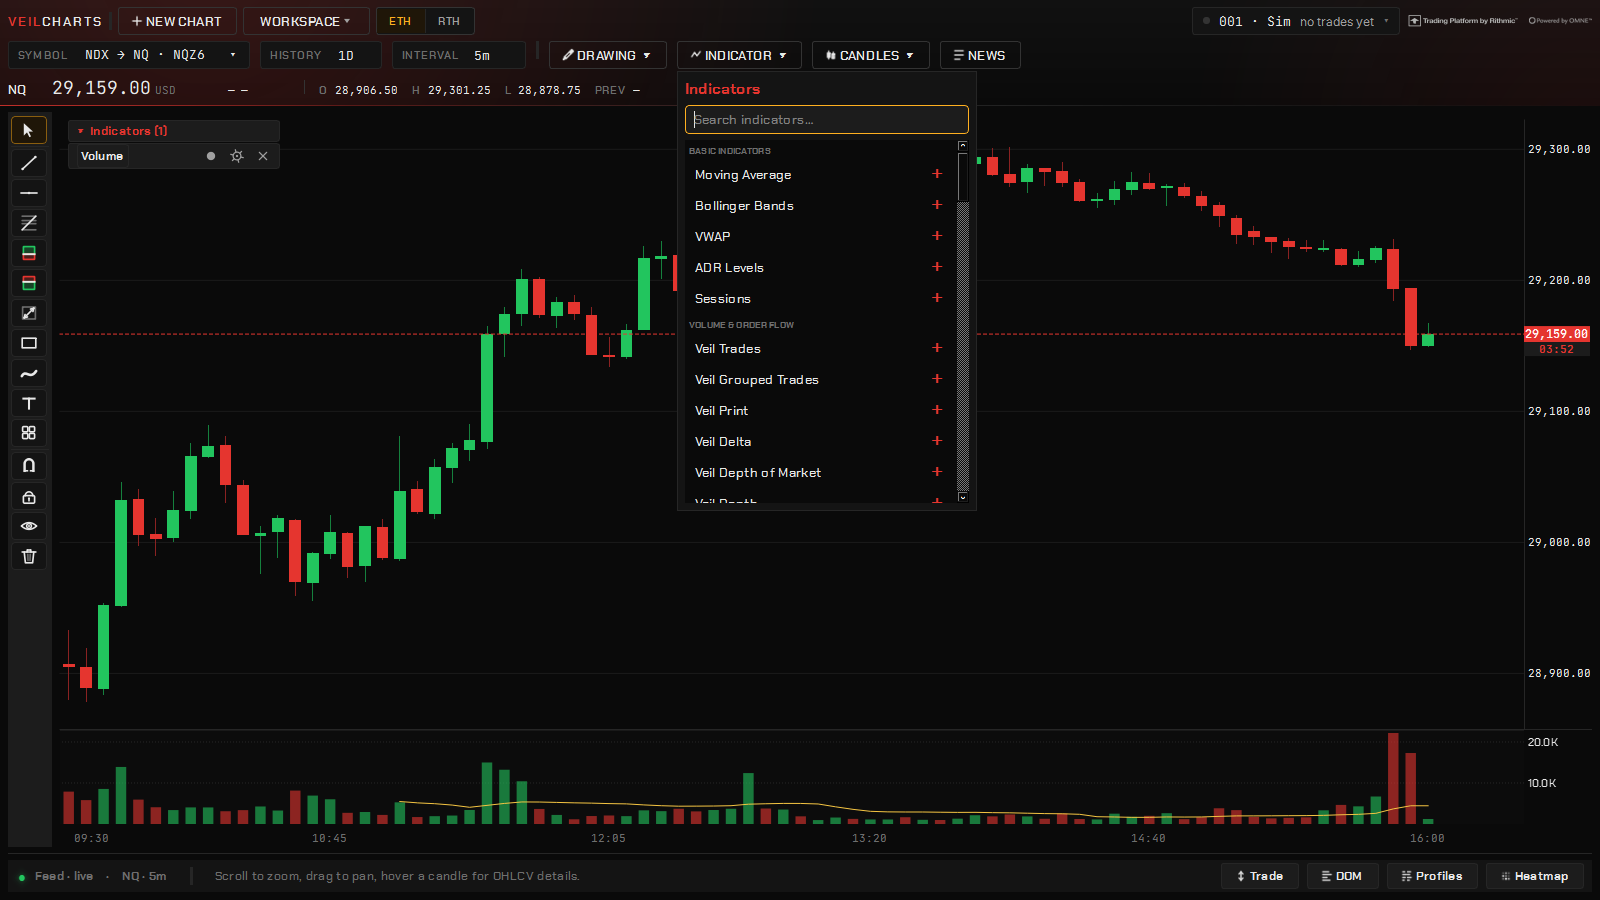
Indicator ▾ — the study picker, grouped into Basic Indicators, Volume & Order Flow and Gamma DP. See Managing studies.
Workspace — save, switch, share and import layouts. See Workspaces.
New chart — another chart, as a tab by default on a single screen. Shift-click for a window.
Options-chain chip — on NQ and ES only: which options book the dealer-positioning studies read (NDX or QQQ on NQ, SPX or SPY on ES). See Gamma studies.
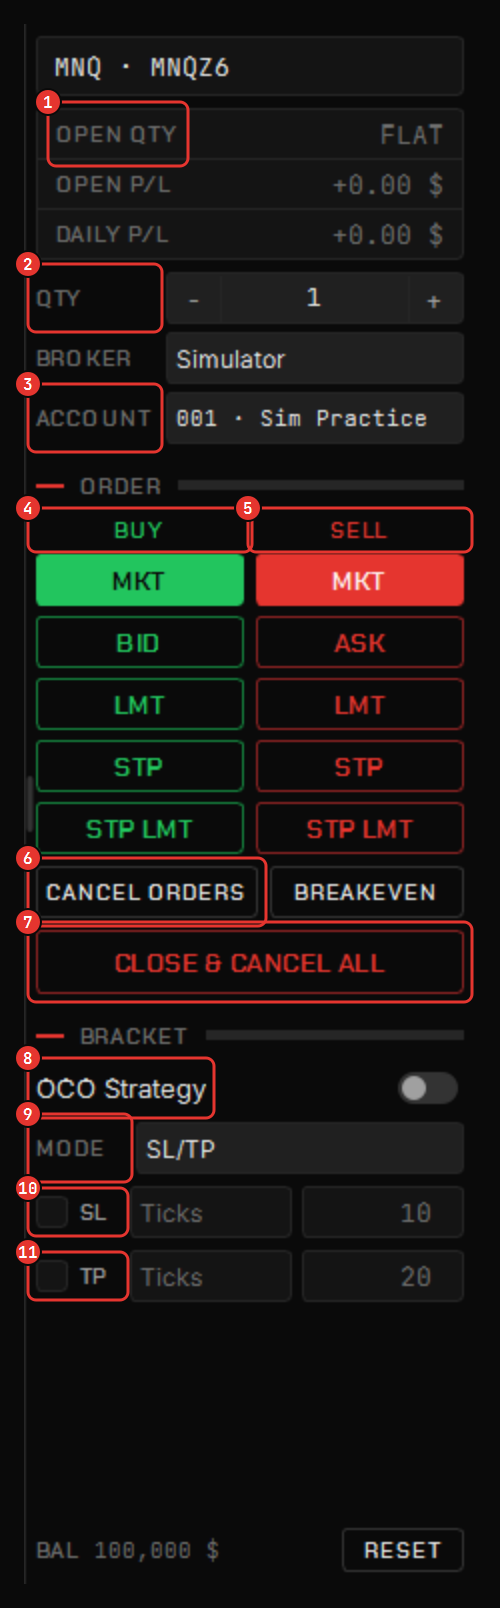
Trade chip and P&L — the account the ticket is on and the open position.
When the window is squeezed the header degrades in stages — the chip loses its word, then the P&L, then the buttons become icons — and the price marks are the last thing to go. Nothing is hidden that you cannot get back by widening the window.
Bar types
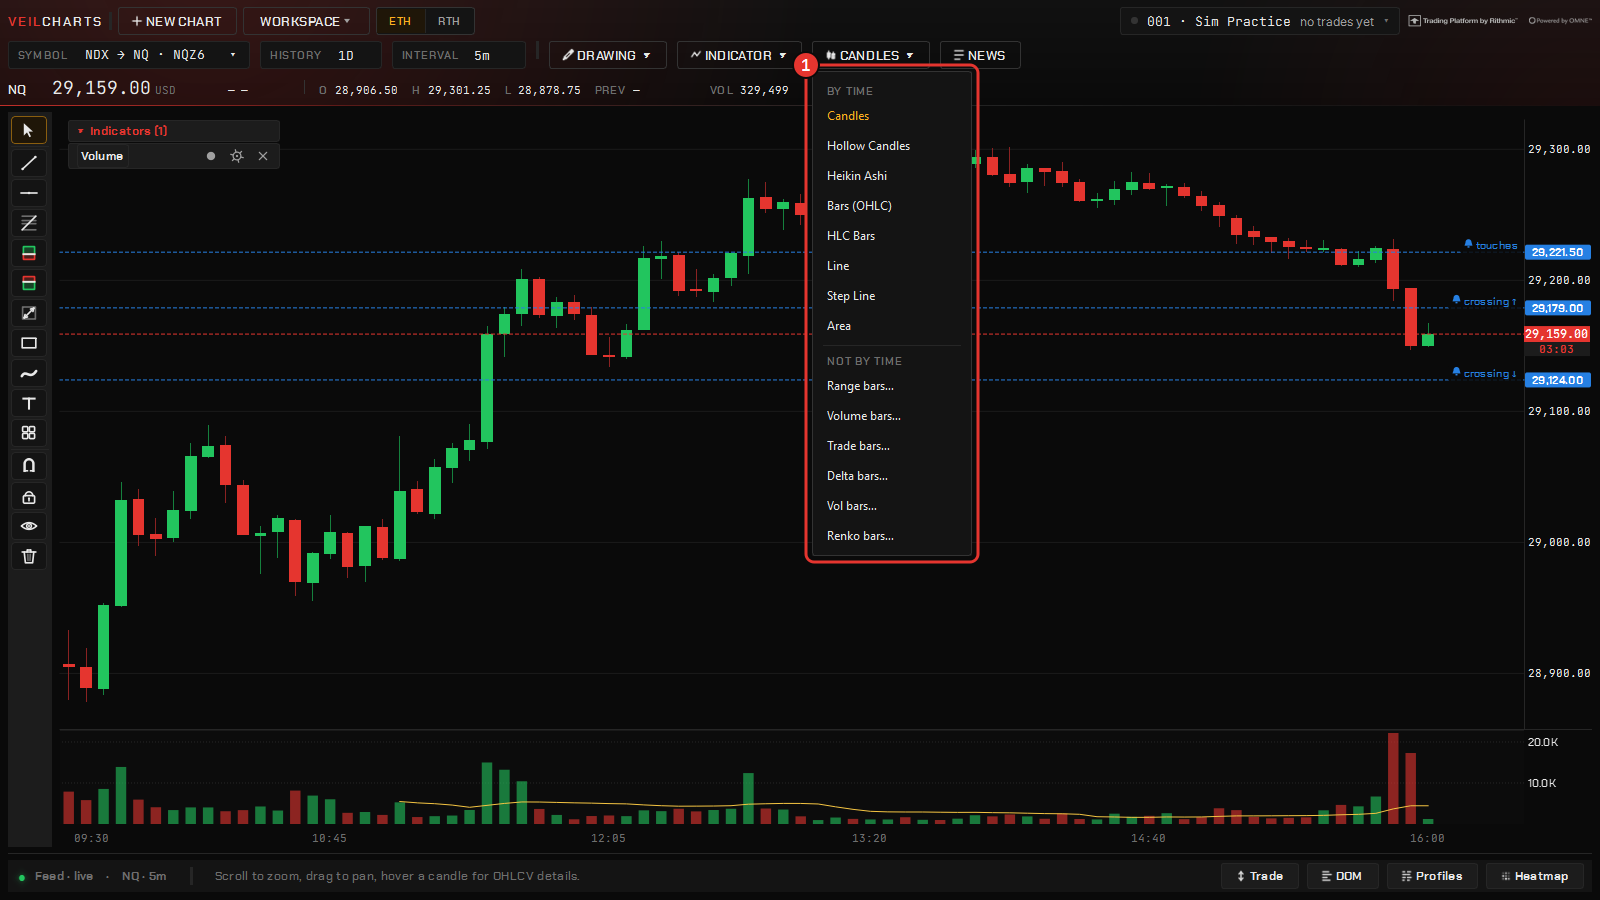
1 The chart-type menu: the display type above the rule, the bar type below it — Time bars, or Range, Volume, Trade, Delta, Vol bars and Renko. Real NQ tape, recorded through Rithmic in September 2026 — shown to illustrate the software, not a forecast or a trading recommendation. Chartveil does not provide or resell market data.
Beyond time bars:
Type
A bar closes after
Range
N ticks of travel
Volume
N contracts
Trade
N prints
Delta
N contracts of imbalance
Vol bars
travel, then a pull-back
Renko
a brick of N ticks
All are built from raw stored ticks rather than resampled from minute data. A range bar resampled from one-minute data cannot know where inside that minute the range completed, so its opens and closes are wrong; building from ticks removes the guess. Every bar type carries a footprint, because they are all built from the same tick history.
To pick one: open the chart-type menu, choose the type, and type its size once. The interval box becomes the size box — changing a 40-tick range chart to 60 is typing where it says RANGE. Picking any candle type takes you back to time bars.
Moving around
To
Do
Zoom time
Scroll over the bars, or drag the time axis
Zoom price
Drag the price axis
Refit price to what is on screen
Double-click the price axis, or right-click → Fit price to view
Let the scale follow price again
Right-click → Auto-scale
Pan
Drag the chart
Move or scale a study pane
Drag the pane’s body to move it, drag its own axis to zoom, double-click the axis to refit; an auto-focus pill brings it back when you wander
Six markets
NQ, ES, YM and RTY and the metals GC and SI, with their micros (MNQ, MES, MYM, M2K, MGC, SIL), including explicit quarterly contracts — on the charts, the ladder, the heatmap, every study, the copier, the Auto Trader and the Risk Manager. Metals contracts roll ahead of first notice day. The dealer-positioning studies stay on NQ and ES, because those are the futures the index options price; on any other chart they say so rather than drawing nothing.
An expired contract month is refused for history — that is the data provider’s rule, not the terminal’s. Use the front month or an explicit quarterly that has not expired.
Chart settings
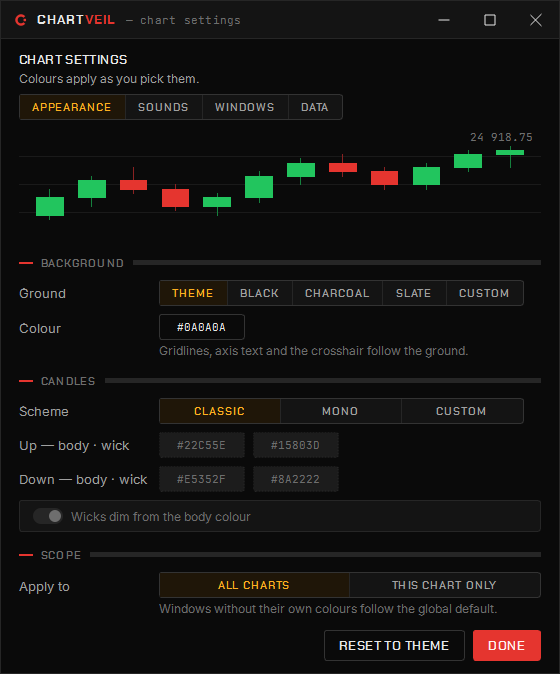
Chart settings → Appearance: the ground, the candle scheme and whether the colours apply to every chart or this one only.
Right-click → Chart settings… (Ctrl+,) has four tabs:
Appearance — the background and the candle colours: a classic scheme, a monochrome one, or your own four colours. Set them once as the global default for every window, or override a single window and the override rides in the workspace. The heatmap paints the same ground and the same candles, and the order ticket’s buy and sell carry the candle colours too, so a change here changes the whole desk consistently. A light background gets dark gridlines and axis text automatically.
Sounds — order events spoken, chimed or your own files, and the spoken economic-release warnings. See Exits, sizing & sounds.
Windows — whether a tool opens in the desk or in a window, and whether a new chart opens as a tab or a window.
Data — the opt-in headline feeds and the free statistics key for the calendar. See News & the calendar.
When a chart looks wrong
“No chart data” — in order of likelihood: the feed is not connected (check the chip in the Command Center); it is the maintenance break, 17:00–18:00 ET; or the contract month has expired. If the feed is up and the contract is live, right-click → Reload chart.
A hole, or a bar that looks wrong — right-click → Reload chart. The contract’s history is requested again and the bars are overwritten in place: stale ones dropped, your drawings, view and scale kept, and no other window on that contract goes blank while it happens. If the hole comes back, note the time window and report it.
A price on the scale that is not a multiple of the tick — a display fault worth reporting with a screenshot.
Your past trades on the chart
Right-click → Historical orders draws every closed trade from your journal on the bars it happened on, entry to exit — the arrow in tells you the direction, the connector and the exit marker how it ended, and the money made or lost sits at the exit. History settings… on the same menu picks the account, how many days to reach back and what the exit label shows. It is the fastest way to review a session on the chart it was traded on.
The desk
Tabs, windows & the Veil Desk
Three ways to arrange the platform — several charts in one window, windows across monitors, or everything docked into one desk.
A Veil Desk with the chart, ladder and heatmap as tiles in one window Real NQ tape, recorded through Rithmic in September 2026 — shown to illustrate the software, not a forecast or a trading recommendation. Chartveil does not provide or resell market data.
Every chart, heatmap and ladder can be its own window, a tab in a chart window, or a tile on a Veil Desk — and they mix. Tabs are for one screen: several charts in one window, one in front at a time. The desk is for seeing things side by side. A chart can be a tab inside a desk tile, and a workspace saves whichever arrangement you built.
Chart tabs
Several charts in one window. The strip in the window’s title bar carries a tab per chart with its market, interval, last price and your position, and a dot when something on that chart wants a look.
To
Do
Open another chart as a tab
+ on the strip, or Ctrl+T
Open it as a window instead
Shift-click New chart, or Ctrl+Shift+N
Move between tabs
Ctrl+Tab / Ctrl+Shift+Tab, or Ctrl+PgDn / PgUp; Ctrl+9 jumps to the last
Tear a tab out into its own window
Drag it out of the strip, or Ctrl+Shift+D
Merge two windows
Drag a window’s tab into another strip
Close a tab
Ctrl+W; Ctrl+Shift+T reopens the last closed
On a single screen new charts open as a tab by default; the default is under Chart settings → Windows.
Windows and monitors
Every chart, heatmap and ladder is its own window, so drag them wherever you like across your screens and save the arrangement as a workspace — it comes back on the same monitors next launch. There is no limit on windows other than what the machine will carry. Windows minimised to the taskbar stop refreshing until they come back, so a parked window costs nothing.
The heatmap, the ladder and a chart being dragged repaint on whole multiples of each monitor’s own refresh rate — 60, 120 or 144 Hz — and follow the window when it moves to another screen. On a display scaled to 125, 150 or 200 % the layers are copied 1:1 rather than resampled, so a scaled desk stays sharp.
The Veil Desk
One window that docks the others. Open it from the Command Center’s Veil Desk tile, then + Add a chart, the ladder, a heatmap, Time & Sales, VeilGEX, News, Veil AI, the alert list, the copier, the Auto Trader or the journal — each becomes a tile.
Arranging tiles
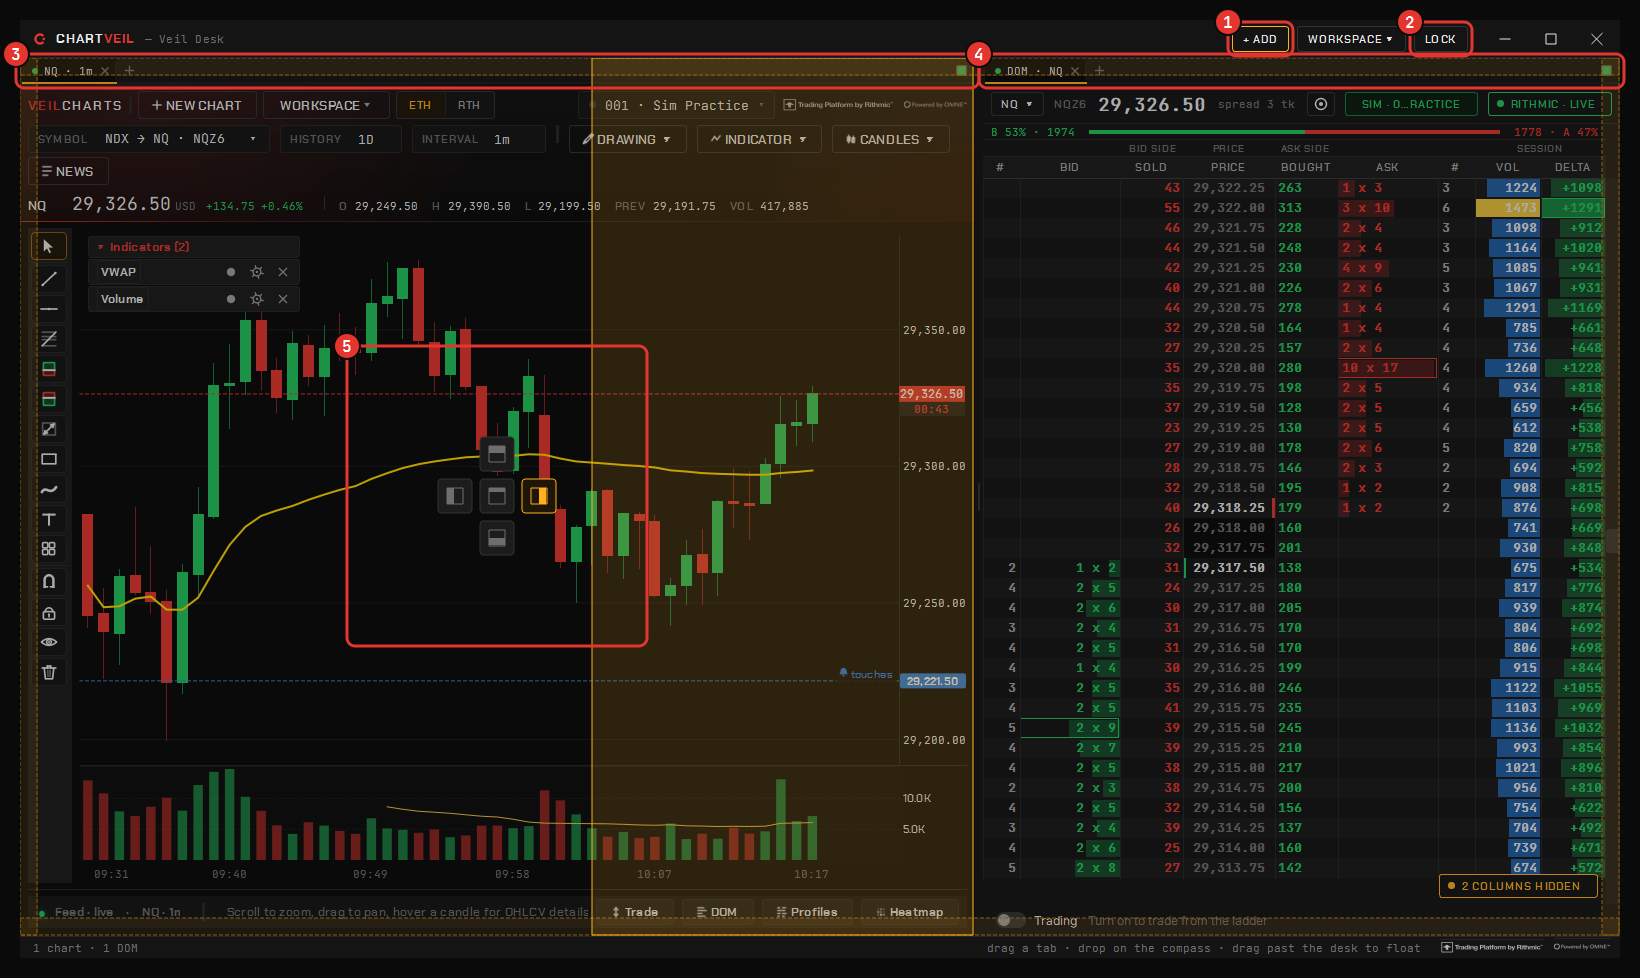
A tab mid-drag. 1 + Add · 2 Lock · 3 the chart tile’s tab strip · 4 the ladder’s · 5 the compass over the target group, its east arm lit — drop here to split beside the chart. Real NQ tape, recorded through Rithmic in September 2026 — shown to illustrate the software, not a forecast or a trading recommendation. Chartveil does not provide or resell market data.
Drag a tile’s tab and a compass appears:
drop on the center to tab it into that group;
drop on an arm to split beside or below;
drop on the desk’s edge to take the whole side;
drop outside the desk to float it as a window.
Double-click a tab to maximise it and again to restore. Lock freezes the layout so a stray drag cannot move anything. The tab strip’s right-click menu floats a tile, moves it to a new desk or closes it.
A heatmap or ladder tile can open with no instrument on it: the picker appears inside the pane, and the chip switches it later.
Open beside
A chart that is a desk pane has Open beside ▸ on its right-click menu: the DOM, the heatmap, the tape, VeilGEX, News or Veil AI on this chart’s instrument, split to its right. It is the quickest way to build the classic chart-plus-ladder-plus-heatmap desk.
Tools that have one home
The copier, the Auto Trader and the journal have one home each. The desk borrows them: the tile shows the tool, and it goes back to its own window when the tile closes. VeilGEX shows a compact face in a small tile — strikes, the surface, the evolution or the history, your pick from a picker on the compact face — and the full dashboard when the tile has room.
Floors
Every pane carries a live floor. The window refuses to shrink under its panes, and the layout gives space back in a ranked order. Below its floor a pane folds instead of clipping: the ladder drops columns into a chip, the VeilGEX bar folds its expiry and view into the symbol menu, and the chart header steps down through its stages. If a tile is too small to be useful, widen it or maximise it.
Where a tool opens
Whether a tool opens in the desk or in a window is under Chart settings → Windows, and you can override it per launch by right-clicking the tile in the Command Center. The desk saves with the workspace, shares with it, and comes back at launch.
The desk
Workspaces
Save whole desks under a name, switch between them, and share one with another trader with nothing private inside.
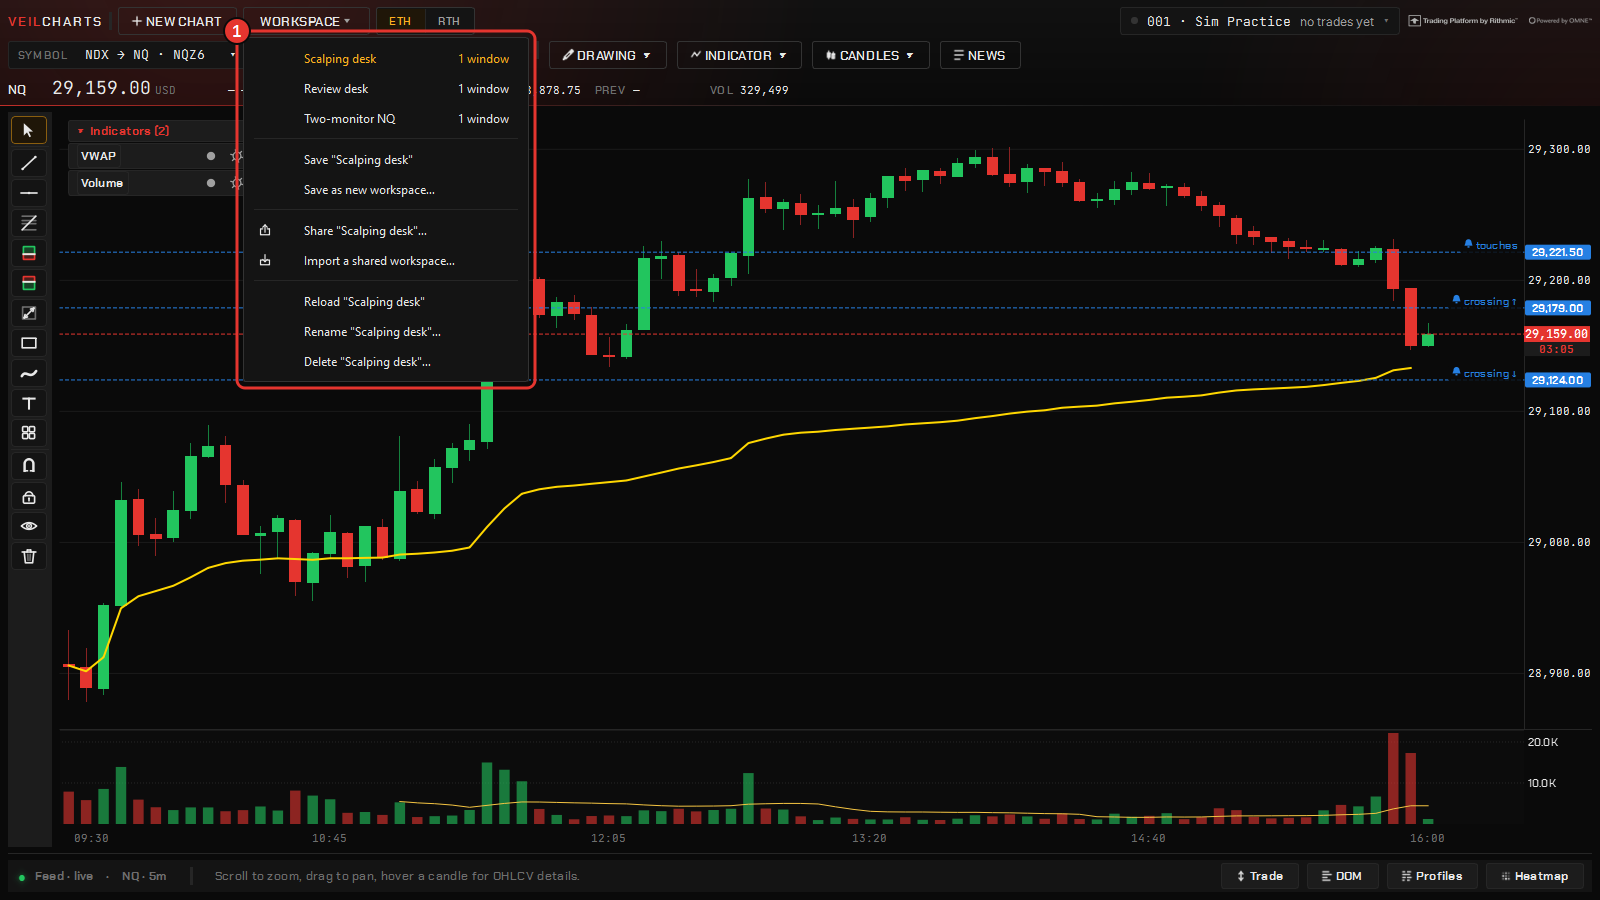
A workspace is your whole desk: chart windows and their tabs, heatmap windows, every Veil Desk with its tiles and splits, their geometry on your monitors and their panel state. Workspaces are named, so you can keep several — a scalping desk, a review desk — and the last-opened one restores at launch.
Saving and switching
1 The Workspace menu: your saved desks with the current one marked, Save and Save as new, Share and Import, then Reload, Rename and Delete. Real NQ tape, recorded through Rithmic in September 2026 — shown to illustrate the software, not a forecast or a trading recommendation. Chartveil does not provide or resell market data.
Open the chart’s Workspace menu:
Save “name” writes the current desk over the workspace you have open; Save workspace as… asks for a new name.
Pick another name on the menu to switch to it. The windows you have open close and the saved ones open in their place, on the same monitors.
The Command Center’s Workspaces tab lists them all, to open, rename or delete.
Workspaces are local to the machine and live in the config folder — see Files, updates & seats. Drawings are saved per chart and come back with the workspace; so do per-window colour overrides, docked panels and the desk layout.
Tip
Save before you experiment. A workspace is cheap and switching back is one click; rebuilding a desk by hand is not.
Sharing a workspace
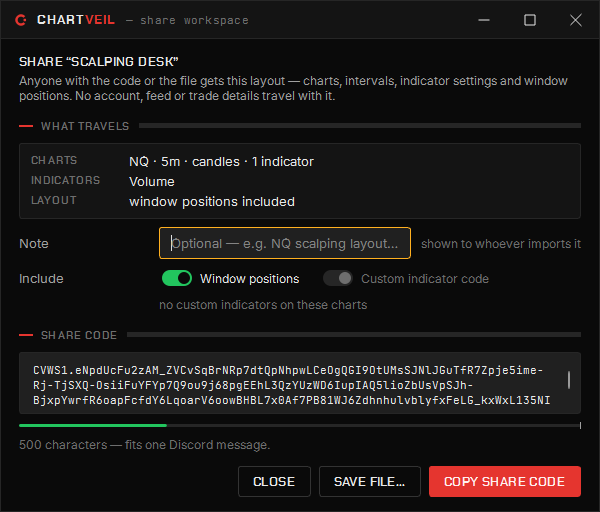
Share: what travels, an optional note for whoever imports it, whether window positions and custom indicator code go along, and the paste code or a file.
From the Workspace menu pick Share… and the layout becomes either a .cvws file or a paste code beginning CVWS1.. Your own Studio indicators are bundled in; account numbers, keys and personal paths are stripped on the way out, so nothing private travels with it.
The other trader opens Import a shared workspace… — on the Workspace menu or the Command Center’s Workspaces tab — pastes the code or drops the file, and gets the same desk. It works between your own machines too: it is the easiest way to move a layout to a new PC.
Moving to a new computer
Install from the dashboard, sign in with the same licence, and copy the config folder across if you want your desk exactly as it was — settings, workspaces, drawings, templates, accounts and the journal all live there. A single layout can travel on its own as a shared workspace file. Nothing about your account is tied to the old machine.
The desk
Drawing tools
Lines, levels, Fibonacci, position tools, anchored VWAP, measurers, zones, and the Veil Profile drawn over any range.
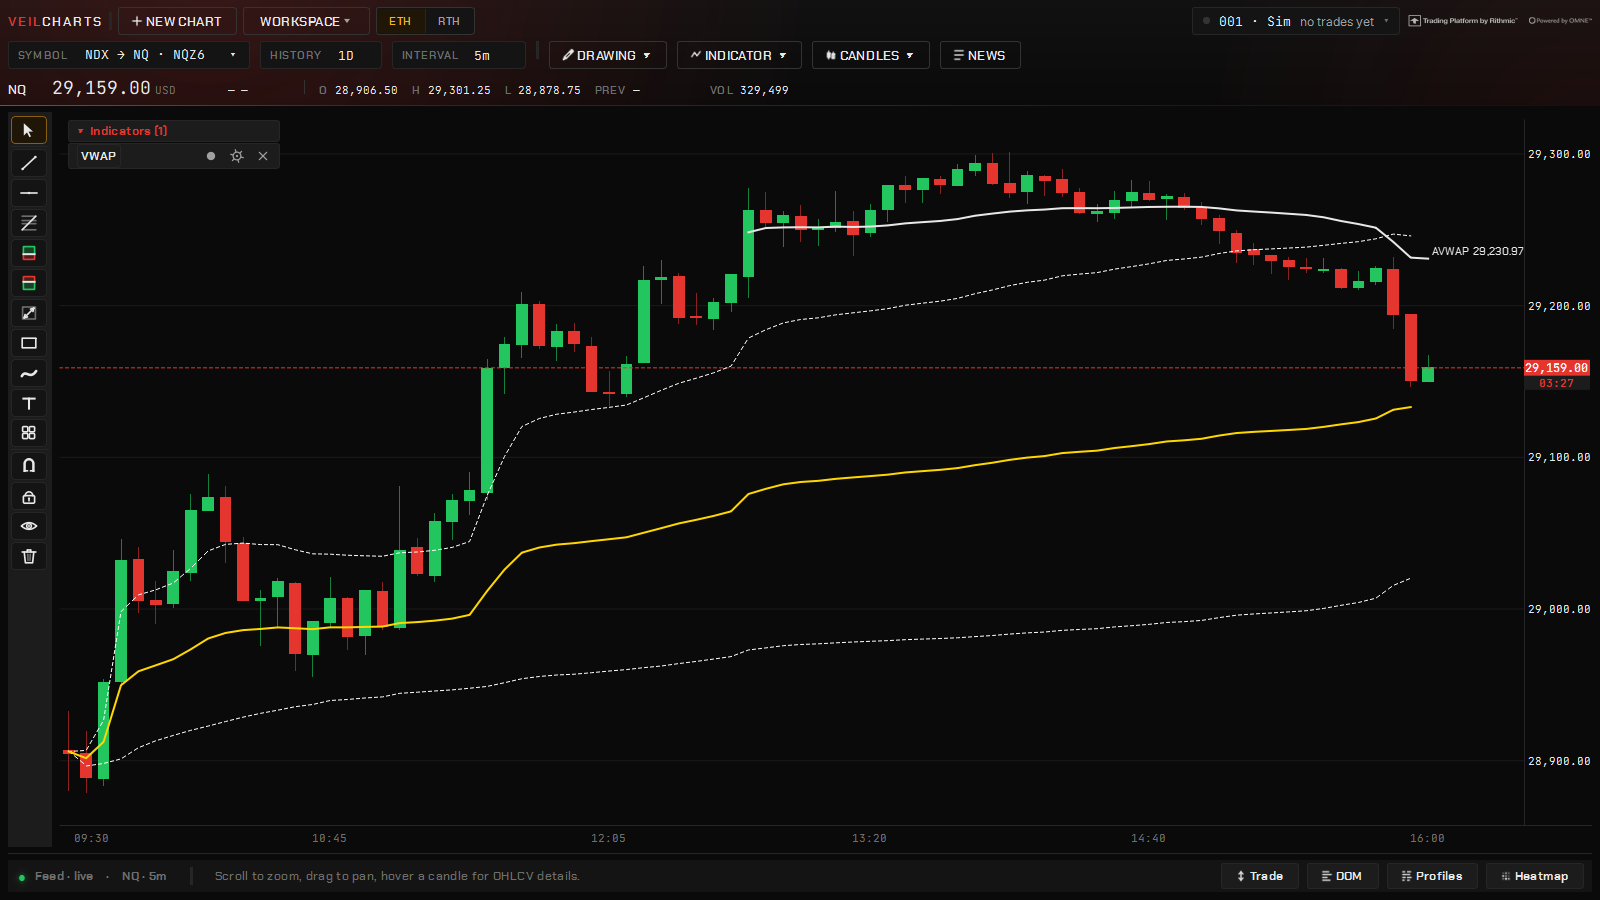
An anchored VWAP drawn from a midday bar (the white line with its AVWAP tag) over the session VWAP study and its first band Real NQ tape, recorded through Rithmic in September 2026 — shown to illustrate the software, not a forecast or a trading recommendation. Chartveil does not provide or resell market data.
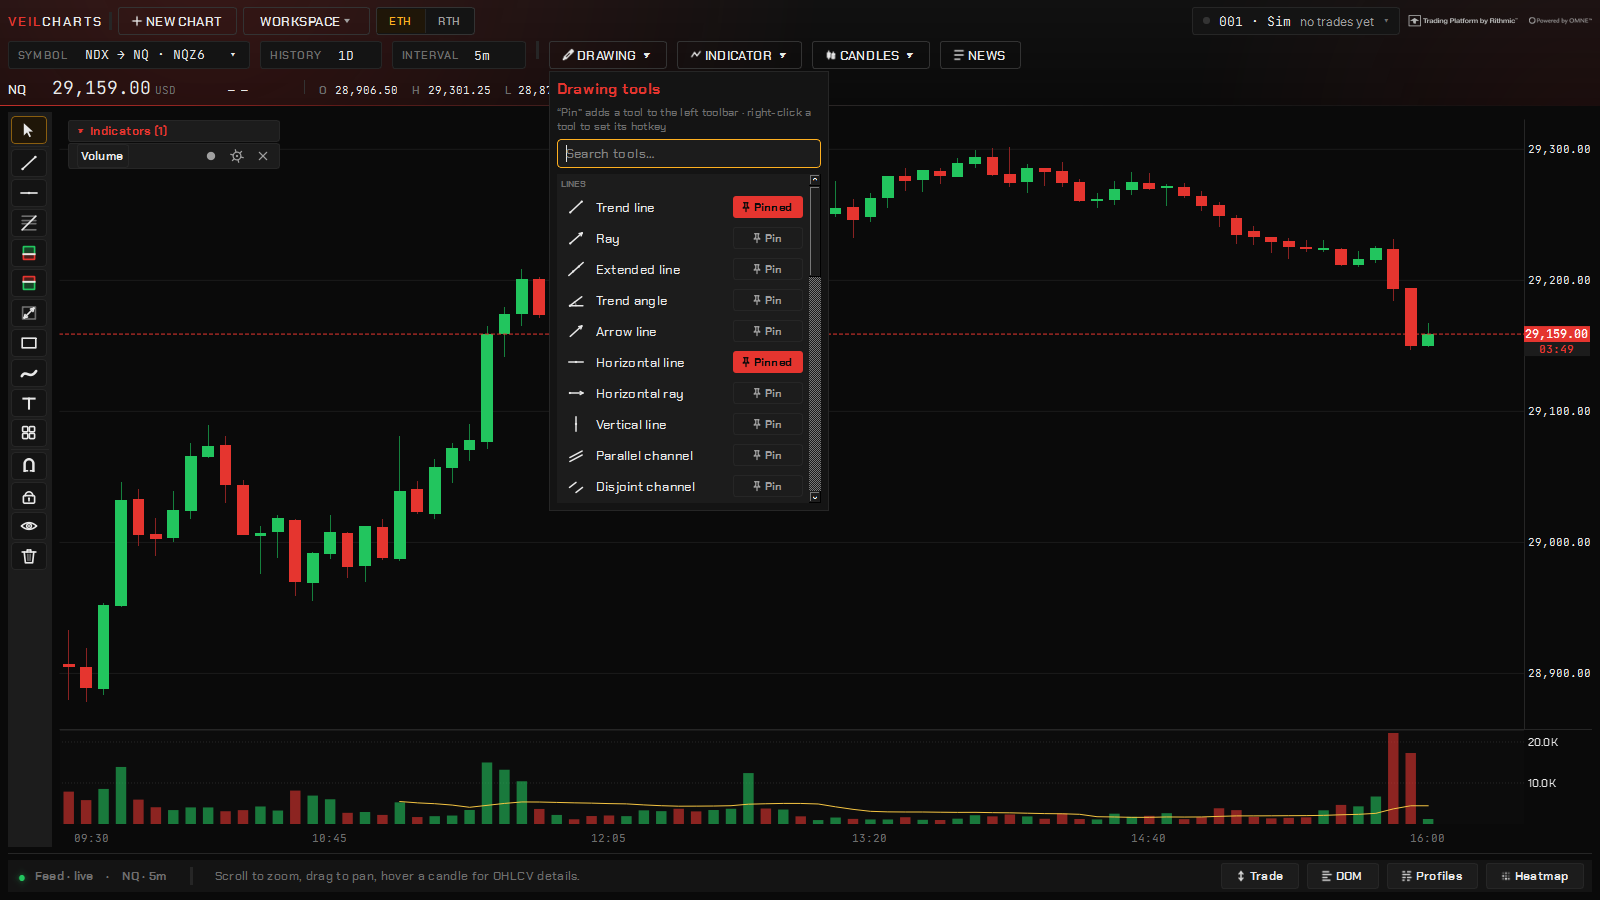
The Drawing ▾ button in the chart header opens the picker. Pick a tool, click on the chart to place its points, and it is drawn. Star a tool in the picker and it is pinned to the left toolbar; a few standard favourites are pinned out of the box.
The tools
The drawing picker under the Drawing button: search, the groups, and Pin to keep a tool on the left toolbar. Real NQ tape, recorded through Rithmic in September 2026 — shown to illustrate the software, not a forecast or a trading recommendation. Chartveil does not provide or resell market data.
Long position and short position (risk and reward as you drag), forecast, bars pattern, anchored VWAP, projection
Measurers
Date and price range, price range, date range
Volume-based
Veil Profile — a volume or delta profile over any range you choose, with its developing POC and value area if you want them
Zones
Rectangle, region (extends left and right), OB (extends right)
Brushes
Freehand brush
Arrows
Arrow, arrow marker, arrow mark up, arrow mark down
Text
Text
The position tools read in ticks and dollars at the traded contract’s point value, so the reward-to-risk they show is the one the ticket will see.
Anchored VWAP
Click the bar to anchor from and the VWAP runs forward from there with its deviation bands. Reset every on its menu restarts it every 15 or 30 minutes, every hour or four, at the New York open (09:30 ET), the trading day (18:00 ET), the week or the month — all on the New York clock — or leaves it continuous. The tag on the chart names the reset.
Editing a drawing
Select it by clicking; drag its points to reshape it or its body to move it.
Right-click a drawing for its colour, width and style, to duplicate it, to lock it (no more accidental drags) or to hide it. More… opens the full property sheet.
Delete or Backspace removes the selected drawing; the toolbar has lock all and delete all.
Esc drops the tool and goes back to the cursor.
Drawings stop at the newest bar rather than drifting into empty space — except the projection tools, which are meant to reach forward.
A drawing as an alert
Right-click a line and switch on Alert when price crosses. The line itself becomes the alert, and it follows the line when you move it. See Alerts.
Where drawings live
Drawings are saved per chart and come back with the workspace. A shared workspace carries them too. The global crosshair is not a drawing — it is a mode — but a level drawn on one chart of a market is a level, and the alert it carries belongs to the market, not the window.
The desk
The global crosshair
One crosshair that marks the same price and moment in every window, and a note on replay.
The global crosshair
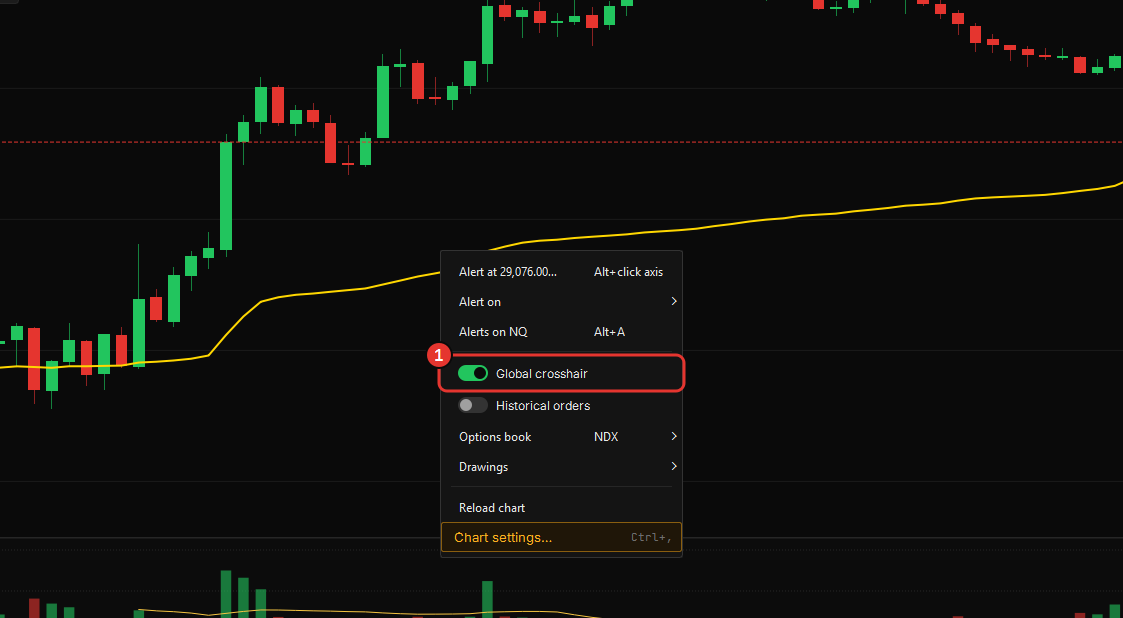
Right-click empty space on a chart. 1 the Global crosshair switch — on here, on in every chart. Real NQ tape, recorded through Rithmic in September 2026 — shown to illustrate the software, not a forecast or a trading recommendation. Chartveil does not provide or resell market data.
Turn it on from a chart’s right-click menu and every window follows your cursor: hold the crosshair on a price and moment in the chart and the heatmap marks the same instant, and the other way round. Chart in one window, book in another, one point in time. The switch is global — on in one window, on in all.
It is not a drawing: nothing is saved, nothing is shared, and it goes with the cursor. To mark a level that stays, draw one (see Drawing tools); to be told when price gets there, arm an alert on it.
Replay
Replay is on the way. The Command Center lists it under the dimmed tiles — the ones that say when they will launch rather than launching — and a chart has no Replay button until it does. When it ships it will run every open window on one clock, and this chapter will cover it.
Note
For rehearsing execution on past bars, the simulator is the tool: it trades the live tape on a practice account with the same ticket and the same rules.
Order flow
Liquidity Heatmap
Resting orders at every price, painted four times a second — where walls build, where they pull, and who is getting hit on the way.
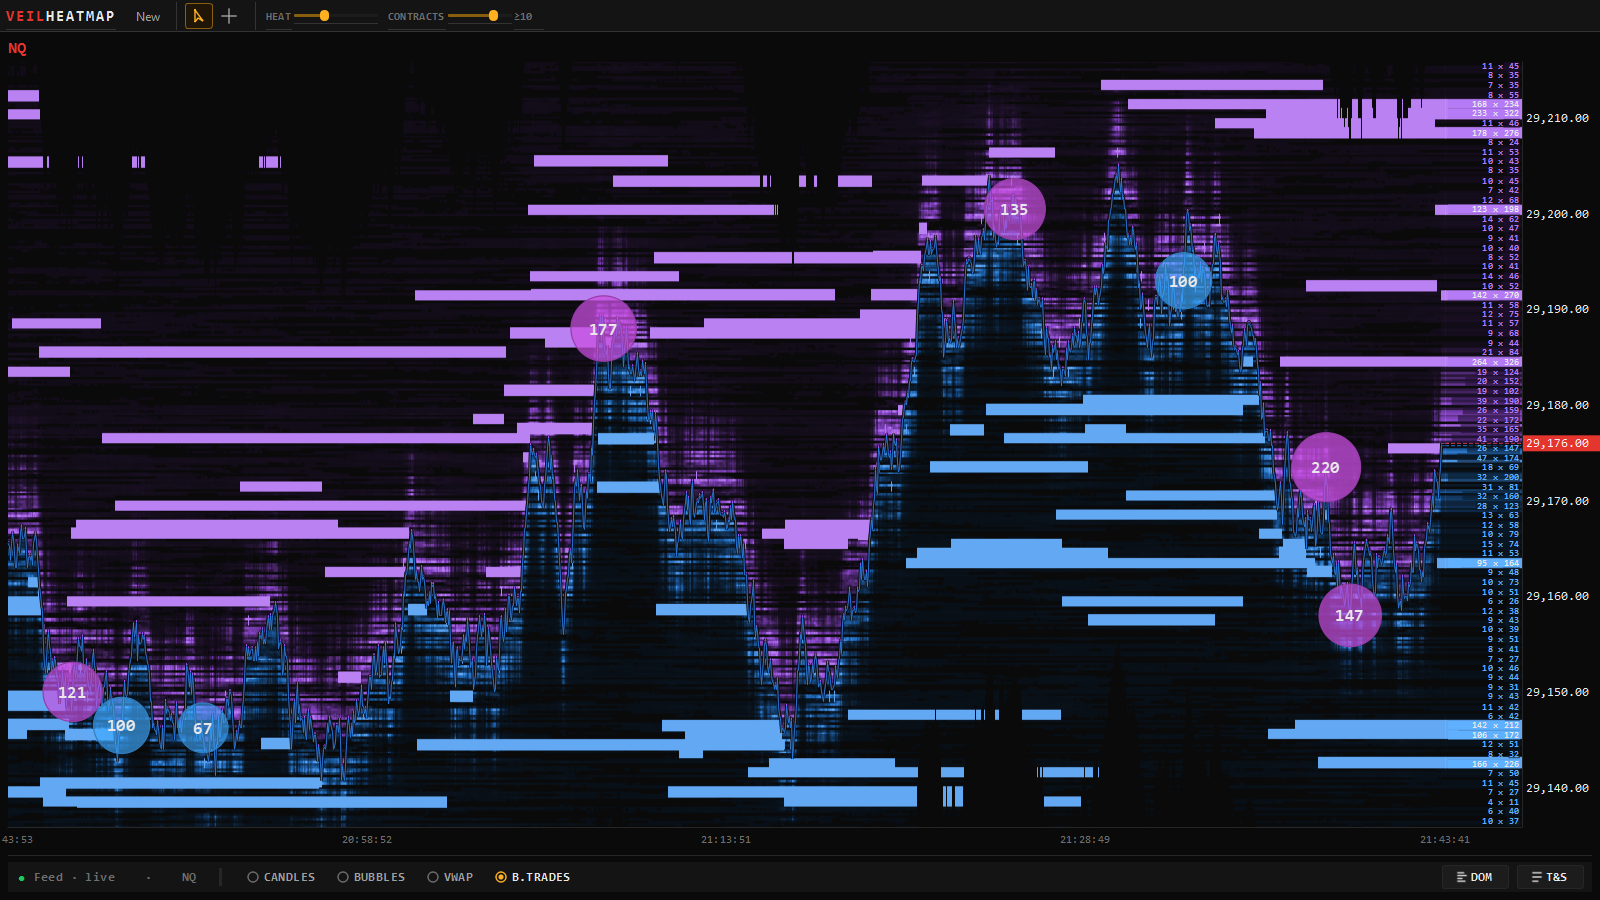
The liquidity heatmap with a wall of resting size, big-trade bubbles and the ladder column Real NQ tape, recorded through Rithmic in September 2026 — shown to illustrate the software, not a forecast or a trading recommendation. Chartveil does not provide or resell market data.
The heatmap draws the book over time. Each row is one tick of price; each column is one snapshot of the book, newest on the right; brightness is resting size. A level that holds size draws a horizontal streak; a cancel ends that streak the instant it happens, which is what makes a pull visible. A volume profile shows where trades happened; a heatmap shows where orders are waiting. The two disagree constantly, and the disagreement is usually the information.
It needs Level 2 on your feed login. Without it the map is empty and the instrument menu says no depth beside the market — see Requirements.
Opening it
From the Command Center’s Liquidity heatmap tile, from + Add on a Veil Desk, or from Open beside ▸ on a docked chart. The window opens with no instrument: pick one on the NQ ▾ chip in its strip. The map paints as soon as the depth feed is up; 90 minutes of recorded depth are kept on disk, so a restart does not start from a blank map.
Reading the map
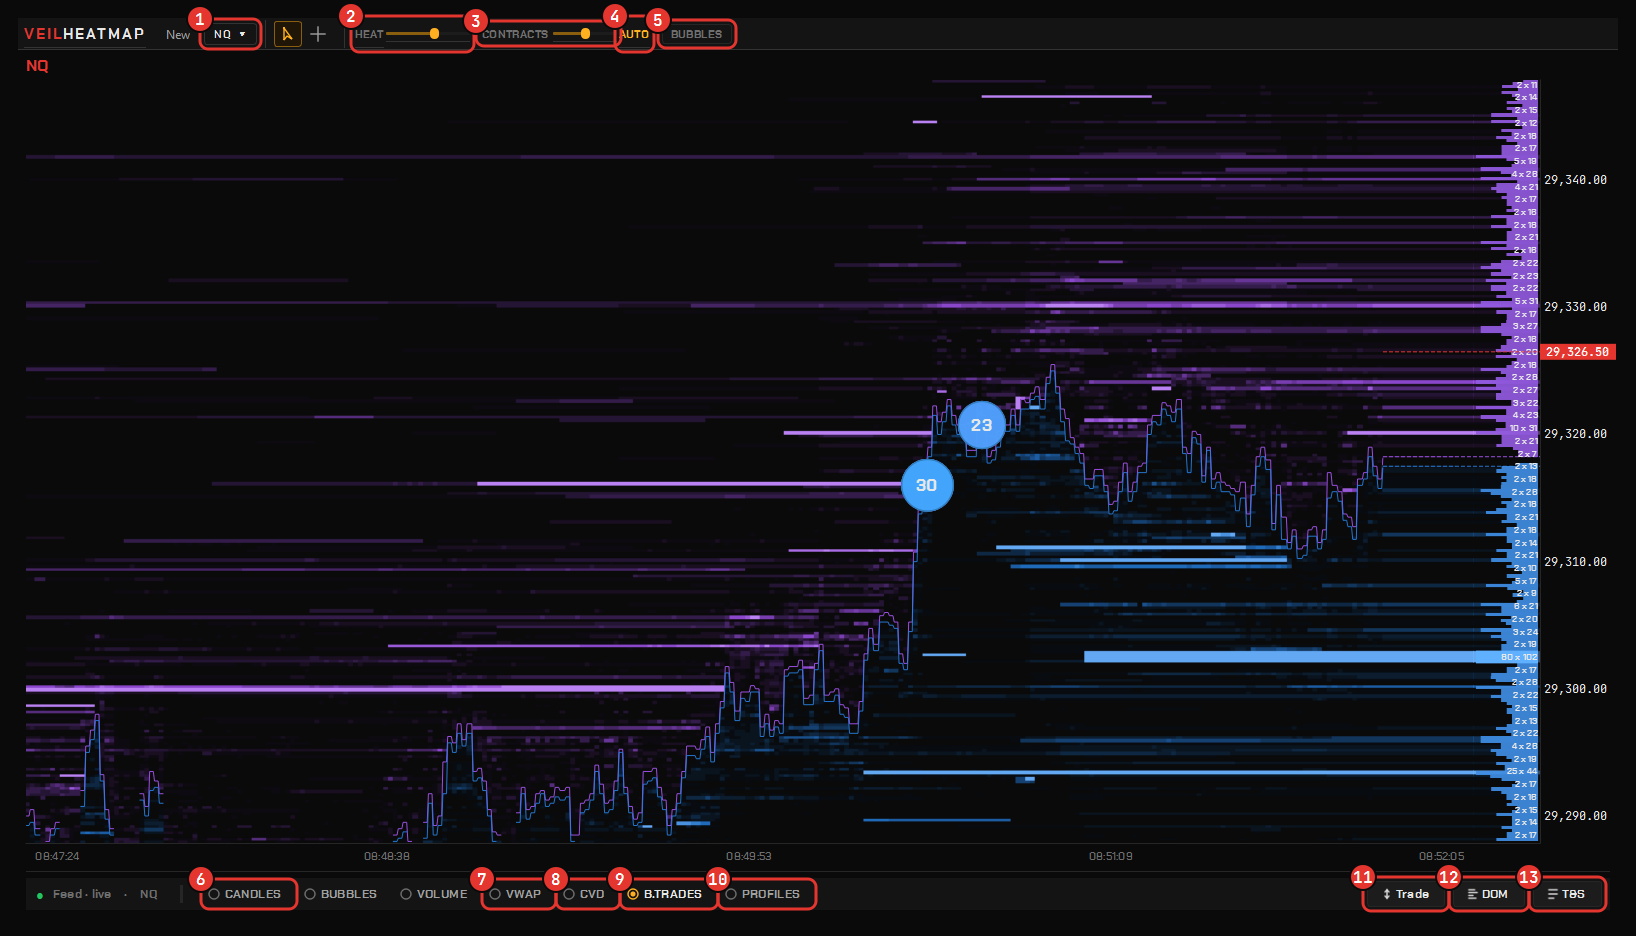
The heatmap window. 1 instrument chip · 2 HEAT ramp and its slider · 3 CONTRACTS size floor and its slider · 4 Auto contrast · 5 Bubbles · 6–10 the layers: candles, VWAP, CVD, big trades, the Profiles dock · 11 Trade · 12 DOM · 13 Time & Sales. Real NQ tape, recorded through Rithmic in September 2026 — shown to illustrate the software, not a forecast or a trading recommendation. Chartveil does not provide or resell market data.
Streaks are resting size holding at a price. Bright and long is a wall that has stood; a streak that ends abruptly as price arrives was pulled — shown to attract price, never meant to be filled. Watching that happen is most of the reason to look at resting liquidity rather than a candle.
The colour range adapts to the book in front of you, so one freak wall cannot flatten the map and thin liquidity still glows faintly instead of being deleted.
The size floor holds the 1–10 contract churn that fills the book all day below the visible range, so the colour ramp is spent on size that could stop price. Raise it on a busy book, lower it on a thin one.
Bid and ask lines are drawn from every price change, not a once-a-second sample, and the recorded history survives a restart so they run unbroken across sessions.
One band per tick. Nothing is bucketed into price groups to save pixels.
The ladder column
At the right edge every level prints biggest × total — the largest single resting order at that price, then the level’s whole book — on a ladder of one bar per price level. One 200-contract order and forty 5-contract orders both total 200 and behave nothing alike; the split is the difference. The heaviest levels are lit. It is the same book as the Advanced DOM, read from the same tape.
Big-trade bubbles
Big-trade bubbles on the side they hit, the bid and ask lines through the heat, and the ladder column printing biggest × total at every level. Real NQ tape, recorded through Rithmic in September 2026 — shown to illustrate the software, not a forecast or a trading recommendation. Chartveil does not provide or resell market data.
Aggressive prints bubble onto the side they hit, sized by contract count, and follow that line as the map scrolls. Click a bubble for its settings: mode (prints or orders), filters, sizing, colours and grouping, saveable as a template. The size floor for what counts as big is shared with Time & Sales and the Veil Trades study, so the three agree.
Bands under the map
Volume — traded volume per column.
CVD — cumulative volume delta as a band of its own with its own scale, a live value chip in the line’s colour and a zero rule, reset at the 18:00 ET session, the New York open, or rolling. It reads as delta, never as a second price track across the heat.
Candles — the chart’s bars over the map, if you want them.
The time axis sits under the bands.
Switch each on or off from the right-click menu’s Show section.
The Profiles dock
A profile column at the edge of the window that runs its full height — through the volume and delta bands to the time axis, on the map’s own price scale. High- and low-volume nodes are marked on it and can be extended across the map as levels. Each column can show volume, delta, bid/ask or the TPO letters; see Profiles.
VWAP and levels
The same engine draws VWAP and its bands on the heatmap and on the chart, so the two windows never disagree about where it is. GEX walls and the flip read here in the same grammar as everywhere else. See Gamma studies.
Switching the market
Click the NQ ▾ chip on the strip, or right-click → Instrument. The window moves to the market you pick with its zoom, look and docked panels carried over — no second window to arrange. Open in a new window instead is on the same menu when you want both, and Duplicate this window copies the one you have.
Navigation
To
Do
Zoom time
Wheel over the map, or Ctrl+wheel
Zoom price around the cursor
Wheel over the price scale
Pan price
Shift+wheel
Pan both axes
Drag
Snap back to the live edge
Double-click, or Esc
Cancel an order or drag in progress
Esc
When you scroll away from the live edge the map holds where you are; Esc or a double-click resumes.
Trading on the heatmap
Orders placed on the chart or the ladder for this instrument draw on the map at their price. Right-click a working order to cancel it, Cancel all working orders pulls everything, and Flatten closes the position. The same rules as everywhere else apply — see The order ticket.
Appearance
Right-click → Appearance… holds the ramp, the size floor, the bubble look and the footer. The map paints the same ground and the same candle colours as Chart settings → Appearance, so a colour change on the chart changes the heatmap too.
Order flow
Veil Print — the footprint
Every executed trade sorted into the price it traded at and split by who was aggressive — eighteen ready-made looks, imbalance in two strengths, and numbers that are real fills.
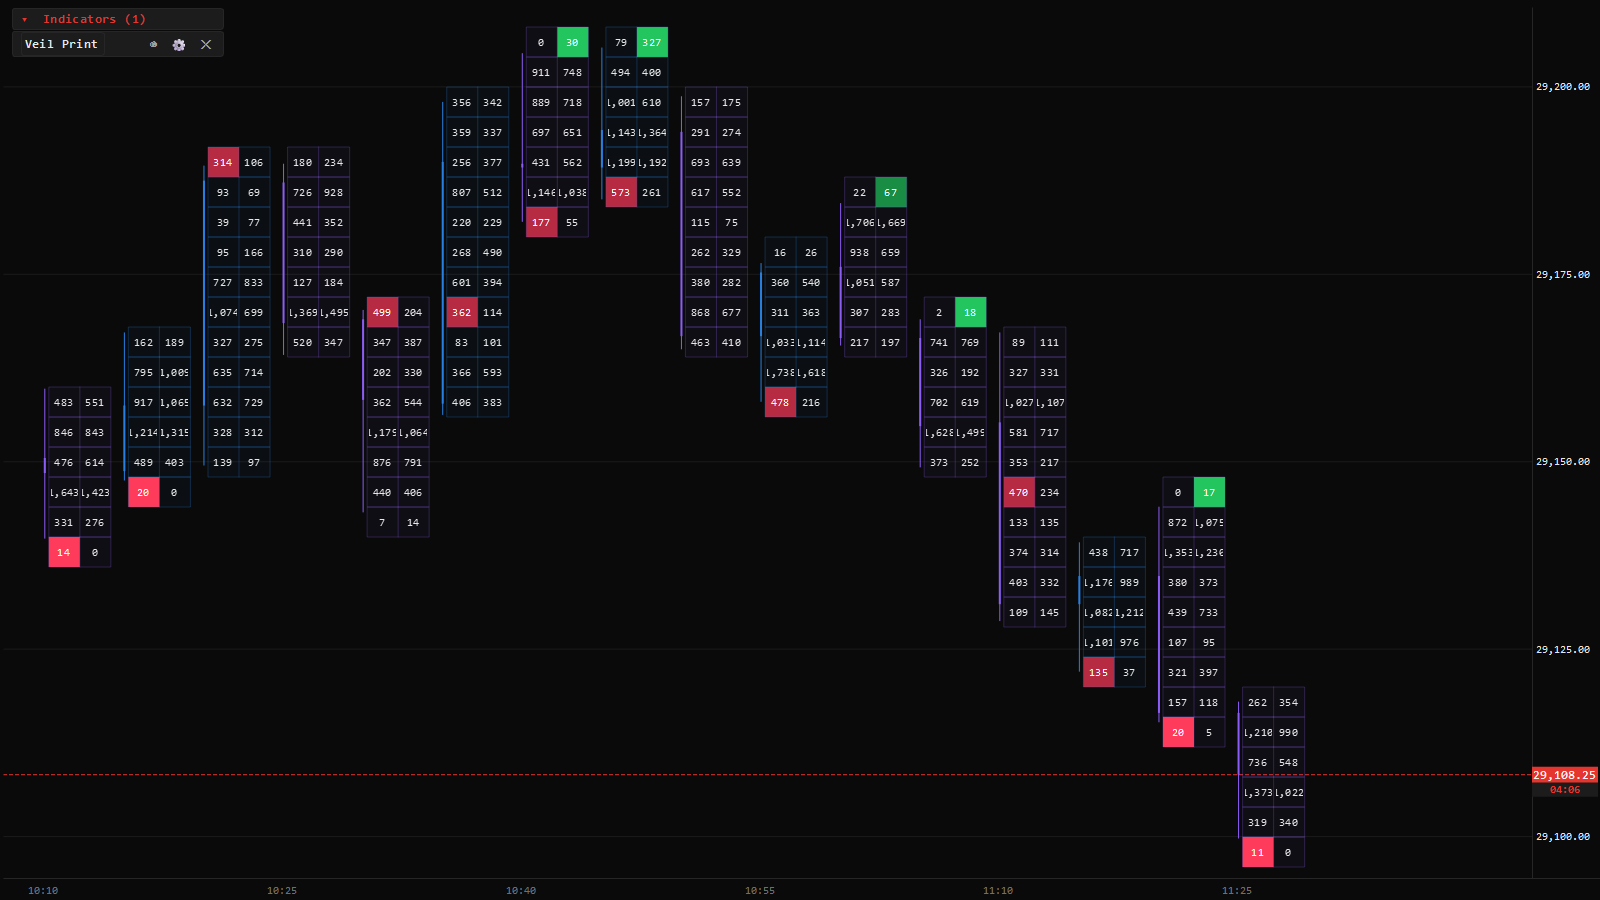
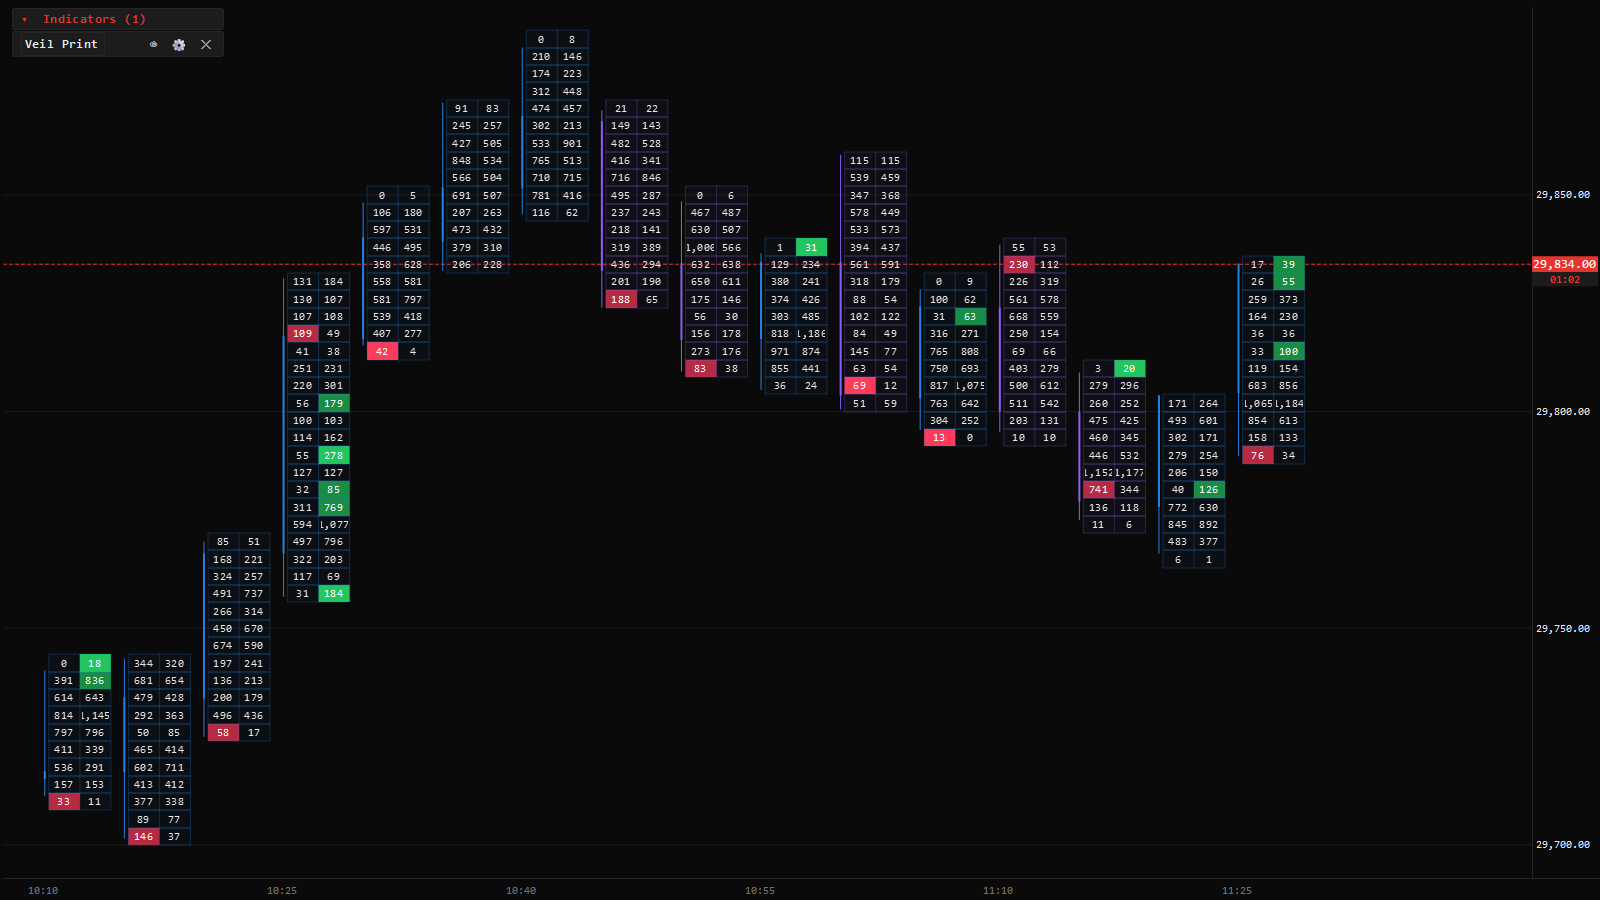
Veil Print footprint bars with bid × ask cells, imbalance highlights and the ghost candle Real NQ tape, recorded through Rithmic in September 2026 — shown to illustrate the software, not a forecast or a trading recommendation. Chartveil does not provide or resell market data.
A footprint opens a bar up to show, at every price it traded, how much volume hit the bid and how much lifted the ask. It answers the question a candle cannot: not just where price went, but who was doing the work at each level on the way.
Veil Print is built from executed trades only. Snapshot and VWAP-update messages that some feeds reuse are discarded before anything is aggregated, so the bid × ask numbers in every cell are real fills, not feed artefacts. That is usually why its numbers differ from another platform’s: if a platform counts those messages as trades, its volume runs high and its delta drifts.
Adding it
Indicator ▾ → Volume & Order Flow → Veil Print. Choose a Type and a tick grouping and you are done. It works on every bar type — time, range, volume, trade, delta, renko — because they are all built from the same tick history. While tick history is still loading, the corner shows an ≈ bars badge naming why the study is approximating, and it clears on its own.
The eighteen types
Each type is a complete look, not a starting point. Pick the question you want each cell to answer:
Type
Each cell shows
Ask×Bid Split
Volume that hit the bid on the left, lifted the ask on the right
Bid/Ask Ladder
The two sides as bars
Bid × Ask Profile
The split as a profile inside the bar
Bid × Volume × Ask
Bid, total, ask
Volume
Total volume at the price
Volume + Trades
Volume and the number of prints
Number of trades
Prints at the price
Average size
Volume per print
Delta
Ask volume minus bid volume
Delta + Total Volume
Delta beside the total
Delta %
Delta as a share of the cell’s volume
Delta Profile
Delta as a profile inside the bar
Cumulative Delta
Delta running through the bar
Imbalance
Only the cells that pass the imbalance test
Volume / Trades / Delta heatmap
Cells as heat rather than digits
Big Trades
Only prints at or above the big-print floor
Imbalance
Ask×Bid Split on one-minute bars: a strong imbalance fills the cell, the bar’s point of control is outlined, and the ghost candle keeps the price action. Real NQ tape, recorded through Rithmic in September 2026 — shown to illustrate the software, not a forecast or a trading recommendation. Chartveil does not provide or resell market data.
A half-cell lights up when one side is at least 200 % of the diagonally opposite cell — bid at this price against ask one tick below, and the reverse — and the raw difference clears a contract floor. The second test is why 2 | 0 stays plain while 15 | 0 lights up. A weak imbalance reads as bold coloured digits with a rail; a strong one fills the cell, so the two are never confused.
Both the ratio and the floor are settings. Widening the ratio makes almost every cell trip the test, at which point the highlight stops carrying information.
Reading a bar
Every figure is set in a tabular mono face, bid and ask aligned to a hairline gutter.
A quiet wash behind each row scales with its volume; the bar’s point of control is outlined.
Cell shading follows the bar’s own direction, so the grid and the candle never disagree.
The bar’s OHLC stays as a ghost candle behind the cells, so you never lose the price action while reading the volume.
Zoom out and the cells step down to a compact tier and then to heat rather than going blank.
Settings worth knowing
Setting
What it does
Tick grouping
Rows per cell — automatic by zoom, or a fixed number of ticks per row
Filter min / max
Ignore prints below or above a size
Executed trades only
On by default; the message filtering described above
Real bid/ask only
Hide bars whose sides had to be estimated from bar data
Proportion type
How a profile-type cell is scaled: bar-relative, chart-relative, automatic or manual
Draw the candle beside the block / hide the chart’s candles
Delta and cumulative delta across bars are their own studies: Veil Delta and CVD.
Bar statistics — volume, delta, CVD and the extremes as tiles under the chart: Veil Bar Stats.
The big-print floor is shared with the heatmap’s bubbles and Time & Sales.
Order flow
Advanced DOM
The market-by-order ladder — biggest × total at every level, prints landing on the price they hit, and trading from the price when you switch it on.
The Advanced DOM ladder with biggest × total, the volume column and the BUY and SELL columns Real NQ tape, recorded through Rithmic in September 2026 — shown to illustrate the software, not a forecast or a trading recommendation. Chartveil does not provide or resell market data.
The Advanced DOM is a contiguous ladder, one row per tick, centered on the inside market. It prints every visible level as biggest × total, so you can tell one 200-contract order from forty 5-contract orders standing at the same price. It reads the same shared tape as the heatmap, so the two always describe the same instant.
It needs Level 2 on your feed login; without it the ladder says so.
Opening it
From the Command Center’s Advanced DOM tile, + Add on a Veil Desk, or Open beside ▸ on a docked chart. It opens with no instrument: pick one in the header. The header carries the instrument (click it to switch), the last price, the spread and the feed state; a thin bar above the columns shows the bid and ask sums across the visible book.
The columns
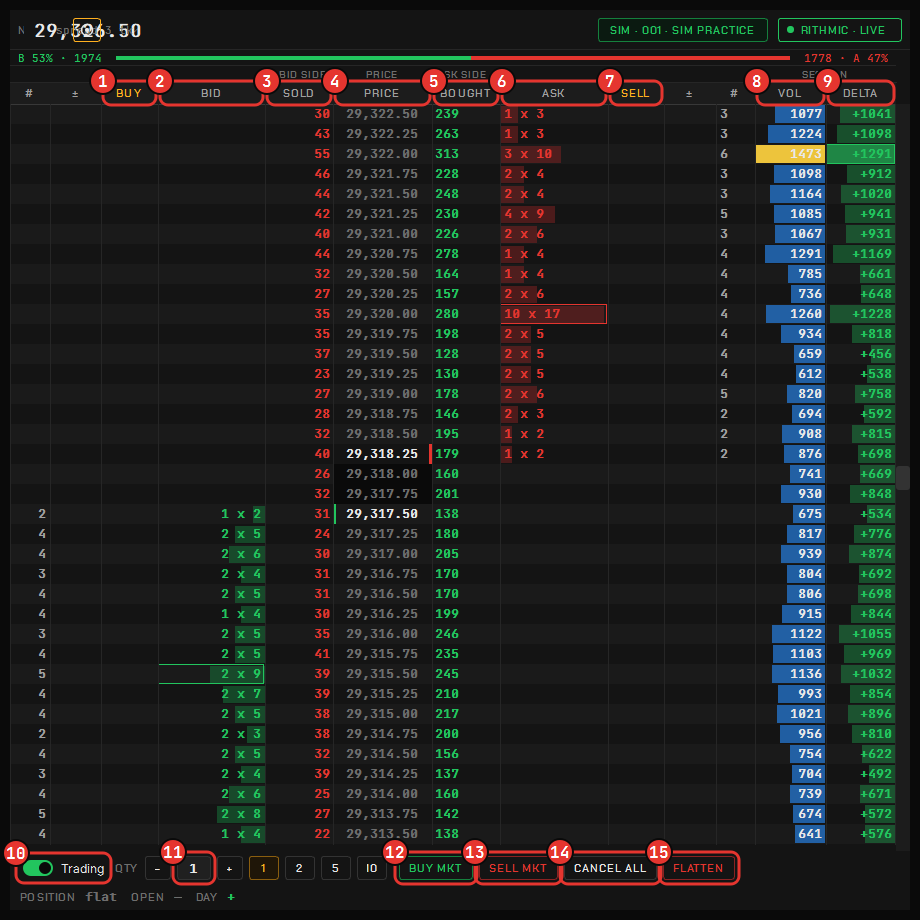
The ladder with Trading on. 1 BUY (your resting buys) · 2 BID biggest × total · 3 SOLD · 4 PRICE · 5 BOUGHT · 6 ASK · 7 SELL · 8 VOL · 9 DELTA · 10 the Trading switch · 11 quantity · 12 BUY MKT · 13 SELL MKT · 14 CANCEL ALL · 15 FLATTEN. Real NQ tape, recorded through Rithmic in September 2026 — shown to illustrate the software, not a forecast or a trading recommendation. Chartveil does not provide or resell market data.
Read across a row, left to right:
Column
Meaning
#
The number of resting orders at the level
±
Size added (green) or pulled (red) there recently
BUY
Your own resting buys
BID
biggest × total — “10 × 13” means the biggest single order is 10 of the 13 contracts standing there
SOLD
Volume that hit the bid at that price
PRICE
The best bid and ask edged, the last trade tinted by its aggressor, your position marked
BOUGHT
Volume that lifted the ask at that price
ASK
biggest × total on the offer
SELL
Your own resting sells
± and #
The ask side’s recent change and order count
VOL
The session profile per price, POC in gold, the value area in blue
DELTA
Buy minus sell volume per price
Green is the buy side and red the sell side — the same pair as the candles and the ticket. Amber is always yours. The biggest level on each side is boxed, so the wall you care about is findable without reading every row. Right-click the column heads to choose which data columns show; a narrow tile folds the outer columns first into a chip.
When depth gets dense, rows drop by size rather than by position, so the levels that matter survive the cull.
Navigation
To
Do
Scroll the ladder
Wheel — it detaches from the market and holds where you are
Recenter on the inside market
Home, a double-click, or the ⊙ button
Resize the rows
Ctrl+wheel
A detached ladder holds an absolute price, so it does not creep with every quote.
Trading from the ladder
Long 4 from the ladder: the position marked on the price column, a working sell limit as an amber chip in SELL, and the strip’s quantity presets, market buttons, CANCEL ALL and FLATTEN. Real NQ tape, recorded through Rithmic in September 2026 — shown to illustrate the software, not a forecast or a trading recommendation. Chartveil does not provide or resell market data.
Trading is off every time the window opens. Turn on the Trading switch in the strip and the BUY and SELL columns wake up:
Click a price in BUY to rest a buy there, in SELL to rest a sell — at or inside the market it rests as a limit, through the market as a stop.
Your working orders sit in those columns as amber chips: drag a chip to move the order, click it to cancel.
The strip has the quantity with presets (+ and − step it), BUY MKT and SELL MKT, CANCEL ALL and FLATTEN, then your position and the day’s P&L.
Esc cancels the order being confirmed, otherwise cancels every working order. It never flattens.
Warning
A live account puts a red edge on the strip and asks for one confirmation per window before the first order leaves. A Risk Manager lockout paints a banner and refuses new entries while FLATTEN stays enabled — a lockout never traps the position it fired on.
Docked beside a chart, the ladder trades through that chart’s ticket — its account, its quantity and its live path — and the strip collapses to via ticket. The rules of the order ticket apply either way.
Chips in the header
Inside the last hour before a high-impact economic release a release chip appears in the header; see News & the calendar. The instrument chip switches the ladder in place, carrying its columns and size.
Order flow
Time & Sales
Every print as it happens, or every aggressive order folded into one row — with a shared floor for what counts as big.
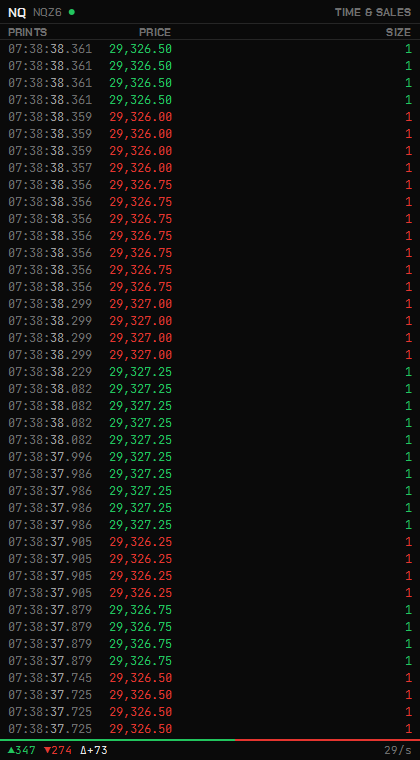
The tape lists every executed trade, newest at the top: time, price and size, the digits in the aggressor’s colour — green when the ask was lifted, red when the bid was hit — with a wash on any print at or above the big-print floor. That floor is the same one the heatmap’s bubbles and the Veil Trades study use, so the three agree about what counts as large. The footer keeps the last thirty seconds of buying, selling and their delta.
Opening it
It opens docked beside a chart or the heatmap, from Open beside ▸ on a docked chart, or as a tile on the Veil Desk from + Add.
Prints and Orders
The tape in Prints mode: time, price and size in the aggressor’s colour, with the last thirty seconds of buying, selling and delta in the footer. Real NQ tape, recorded through Rithmic in September 2026 — shown to illustrate the software, not a forecast or a trading recommendation. Chartveil does not provide or resell market data.
Right-click for the menu.
Prints is the raw tape, one row per execution.
Orders folds the fills of one aggressive order into a single row with its total, how many prints it took and the last level it reached — which is what a sweep looks like from the other side. A 150-contract order that swept six levels reads as one 150-contract decision instead of six fragments.
A size filter on the same menu hides the churn.
Scrollback
Scroll up and the tape pauses where you are, with an amber chip counting the prints that have arrived since — click it to resume at the live edge.
Release chip
Inside the last hour before a high-impact economic release the tape’s header carries a release chip with the countdown; see News & the calendar.
Order flow
Profiles — volume, delta, TPO
Where the volume happened and who was aggressive there — session and composite profiles, the TPO letters, the full-height Profiles dock, and bar statistics as tiles.
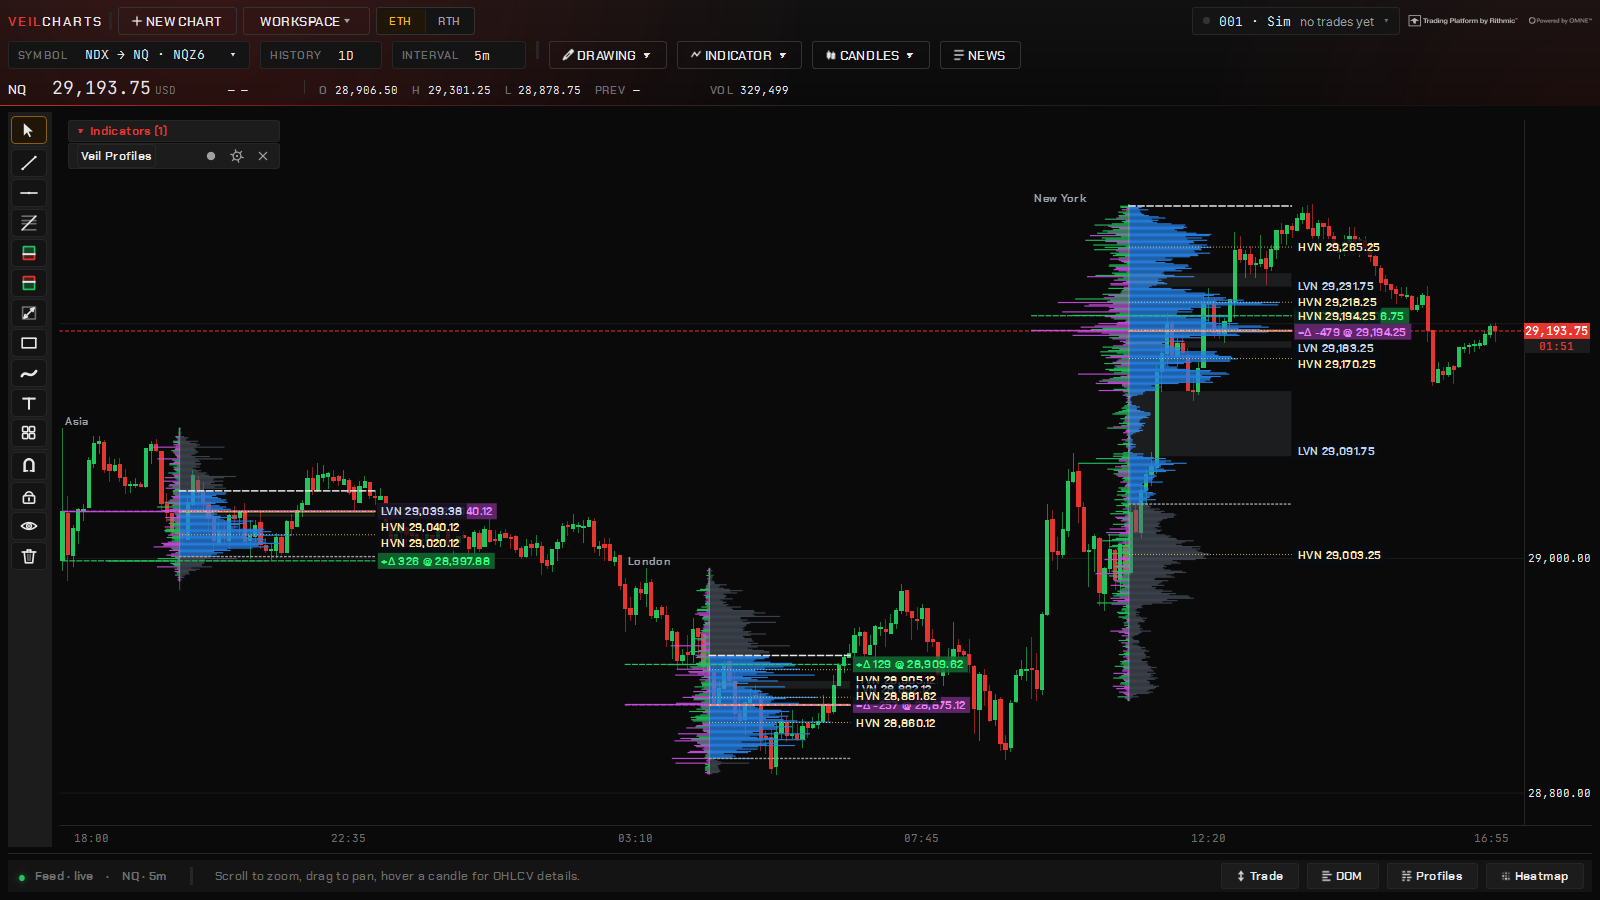
Veil Profiles in Delta + Volume mode, one profile per session across a trading day — Asia, London and New York — with the high- and low-volume nodes chipped Real NQ tape, recorded through Rithmic in September 2026 — shown to illustrate the software, not a forecast or a trading recommendation. Chartveil does not provide or resell market data.
A profile turns a range of bars on its side: at each price, how much traded. Chartveil builds every profile from stored ticks, not from bars, so VAH, VAL and POC land on the exact tick they belong to.
Three tools draw profiles:
Veil Profiles — the study, auto-anchored to sessions, days, weeks or a composite. This chapter.
Veil Profile — the drawing, over any range you choose. See Drawing tools.
The Profiles dock — a column at the edge of a chart or heatmap that runs the full height of the window.
The vocabulary
POC — point of control, the price with the most volume in the range.
Value area — the band around the POC holding a set share of the range’s volume, grown out from the POC one level at a time. Its edges are VAH and VAL. The convention is 68 % — the one-standard-deviation figure it derives from; 70 % is a rounding that stuck. Set Value area % either way.
HVN / LVN — high- and low-volume nodes, the peaks and valleys of the shape, marked with how pronounced each one is.
Veil Profiles — the study
Indicator ▾ → Volume & Order Flow → Veil Profiles. One study, five modes:
Mode
The question
Volume
How much traded at each price
Delta
At each price, who was the aggressor — a high-volume level where selling hit the bid reads very differently from the same volume lifted at the ask
Delta + Volume
Both, side by side
Bid / Ask
The split at each price
TPO Profile
Time at price, as letters — below
Period anchors the profile: Session, ETH / RTH, Overnight, Daily, Weekly, Monthly, a number of minutes, the latest bars, the visible range, or a Composite of several periods. Profiles shown is how many are drawn back — six covers a trading week and redraws instantly; it is the first thing to turn down if a chart feels heavy.
Other settings: input data (volume or number of trades), min and max trade size filters, peaks and valleys with their sensitivity, volume coloured by value area or as heat, a summary line and the profile’s own VWAP over each profile, and the developing POC and value area.
Developing POC, VAH and VAL
The value area as it built, stepped bar by bar through the session — so you can see where the fair-value band was when the trade you are reviewing was open, not just where it finished. Switch on developing POC and developing VA; the delta POC has its own switch.
The TPO profile
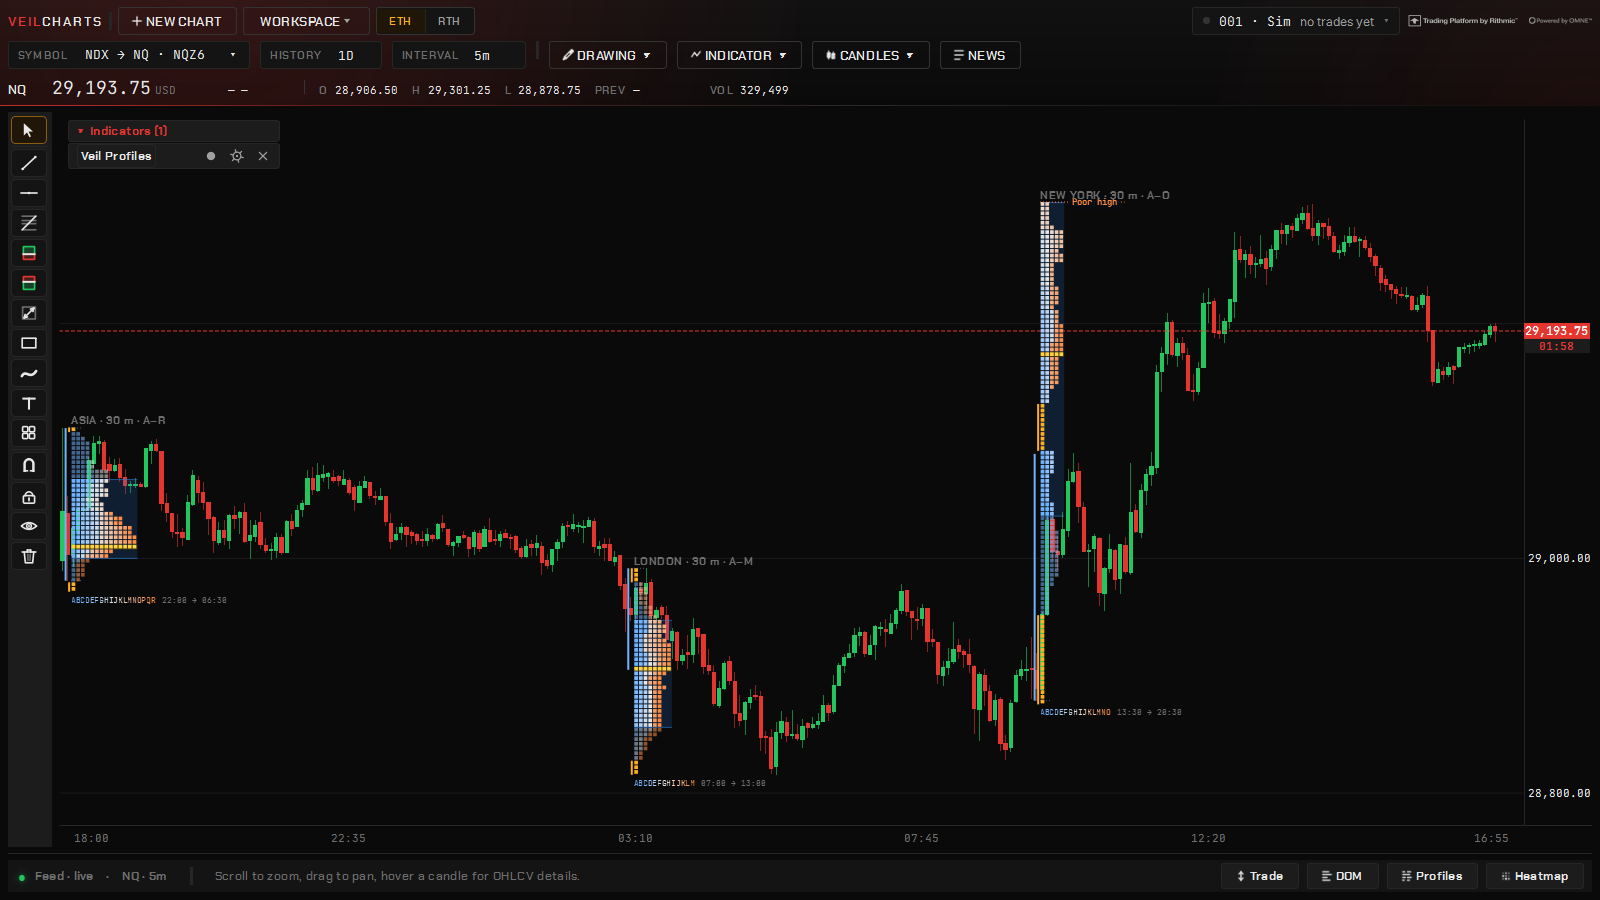
Veil Profiles in TPO mode across a trading day: Asia, London and New York as letter profiles inked by time, with the initial balance and the single-print rails. Real NQ tape, recorded through Rithmic in September 2026 — shown to illustrate the software, not a forecast or a trading recommendation. Chartveil does not provide or resell market data.
The classic letter profile: each letter is a time period that traded at that price, so the shape shows time spent where a volume profile shows size done. Balance, single prints and poor highs and lows read at a glance.
The letters are inked by when they printed — the opening periods in blue, the middle of the session in white, the last periods in orange — with no cell fills to bury them, so you can see which part of the day built a shelf. The value area and the POC are washes, every single-print run gets a rail, the initial balance is marked, poor highs and lows are flagged, and a key under the profile names the periods. Zoomed out, the letters give way to blocks and then to a silhouette rather than disappearing.
Settings: TPO bracket (minutes per letter, 30 by default), ticks per row, column width (scales the letter pitch from half a row to three), which side the letters sit on when paired with a volume profile, the letter colour (Time ink or one colour), the IB period count, and the companion profile drawn beside the letters. Any other mode can add TPO beside it.
The Profiles dock
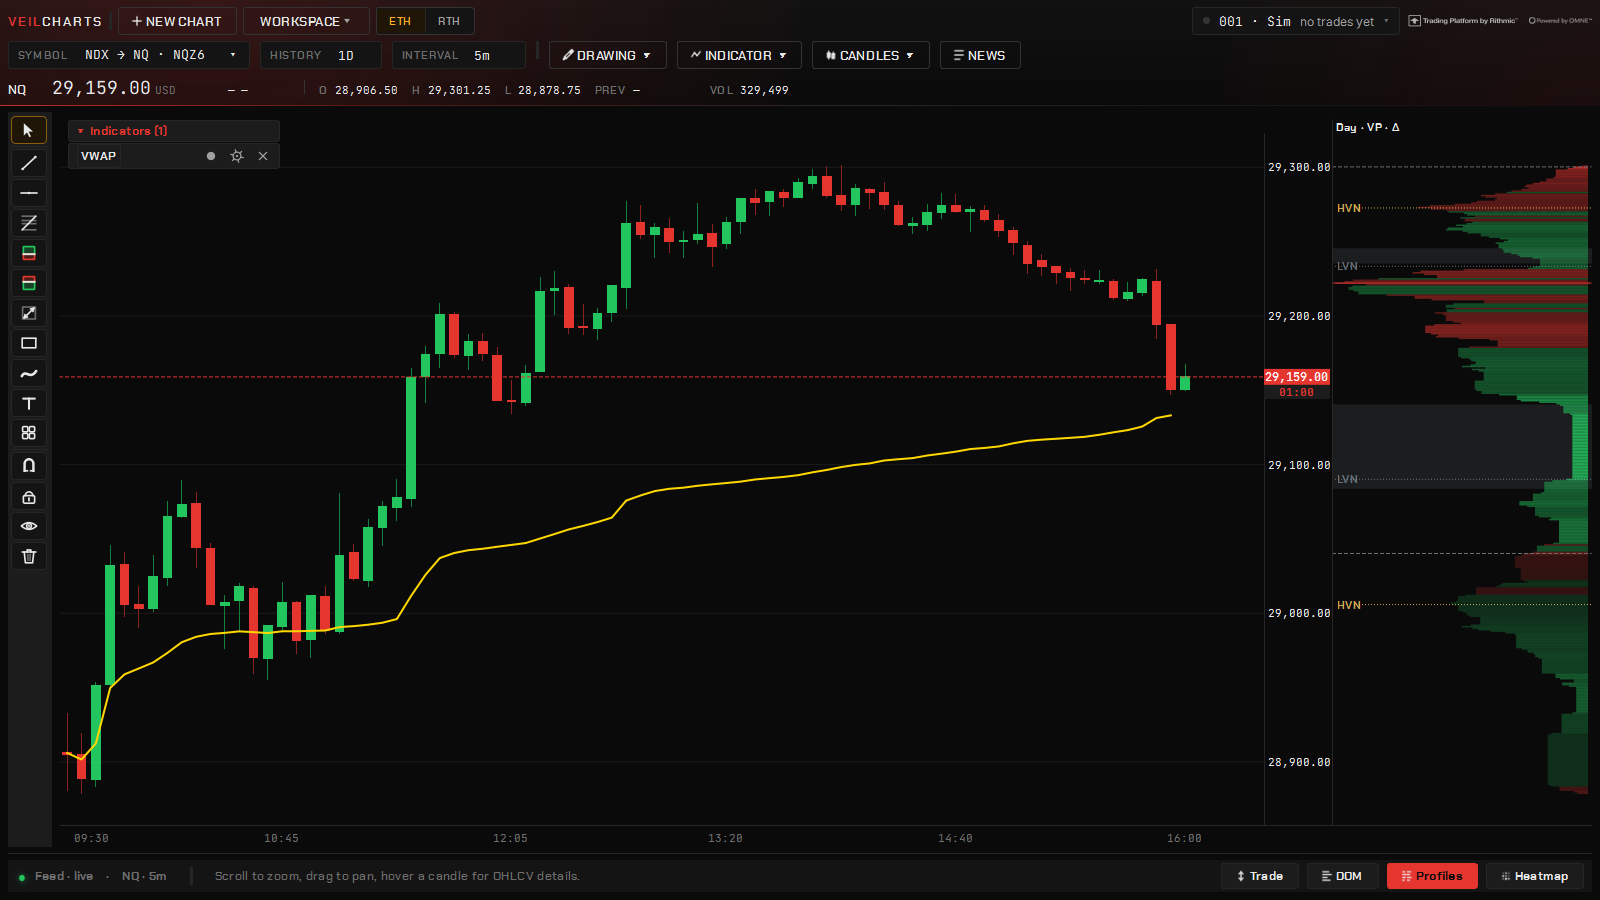
The Profiles dock at the chart’s edge: the day’s volume profile coloured by delta, with the high- and low-volume nodes chipped on the price scale. Real NQ tape, recorded through Rithmic in September 2026 — shown to illustrate the software, not a forecast or a trading recommendation. Chartveil does not provide or resell market data.
A profile column at the edge of any chart or heatmap that runs the full height of the window — on the heatmap it continues below the map, through the volume and delta bands, on the map’s own price scale. Open it from the chart’s or the heatmap’s right-click menu.
Data per column: Volume, Volume coloured by delta, Delta, Bid / Ask split, or TPO.
Period: Day, Week, Month, or the visible range.
Move left / right to reorder columns, and a width per column: narrow (½), normal, wide (1½) or double.
Peaks and valleys are marked on the column, and a switch extends them across the chart as levels — the dock is where the HVN chips on the chart come from.
The bracket and row knobs for a TPO column are in the dock menu and in the heatmap’s Settings.
Veil Bar Stats
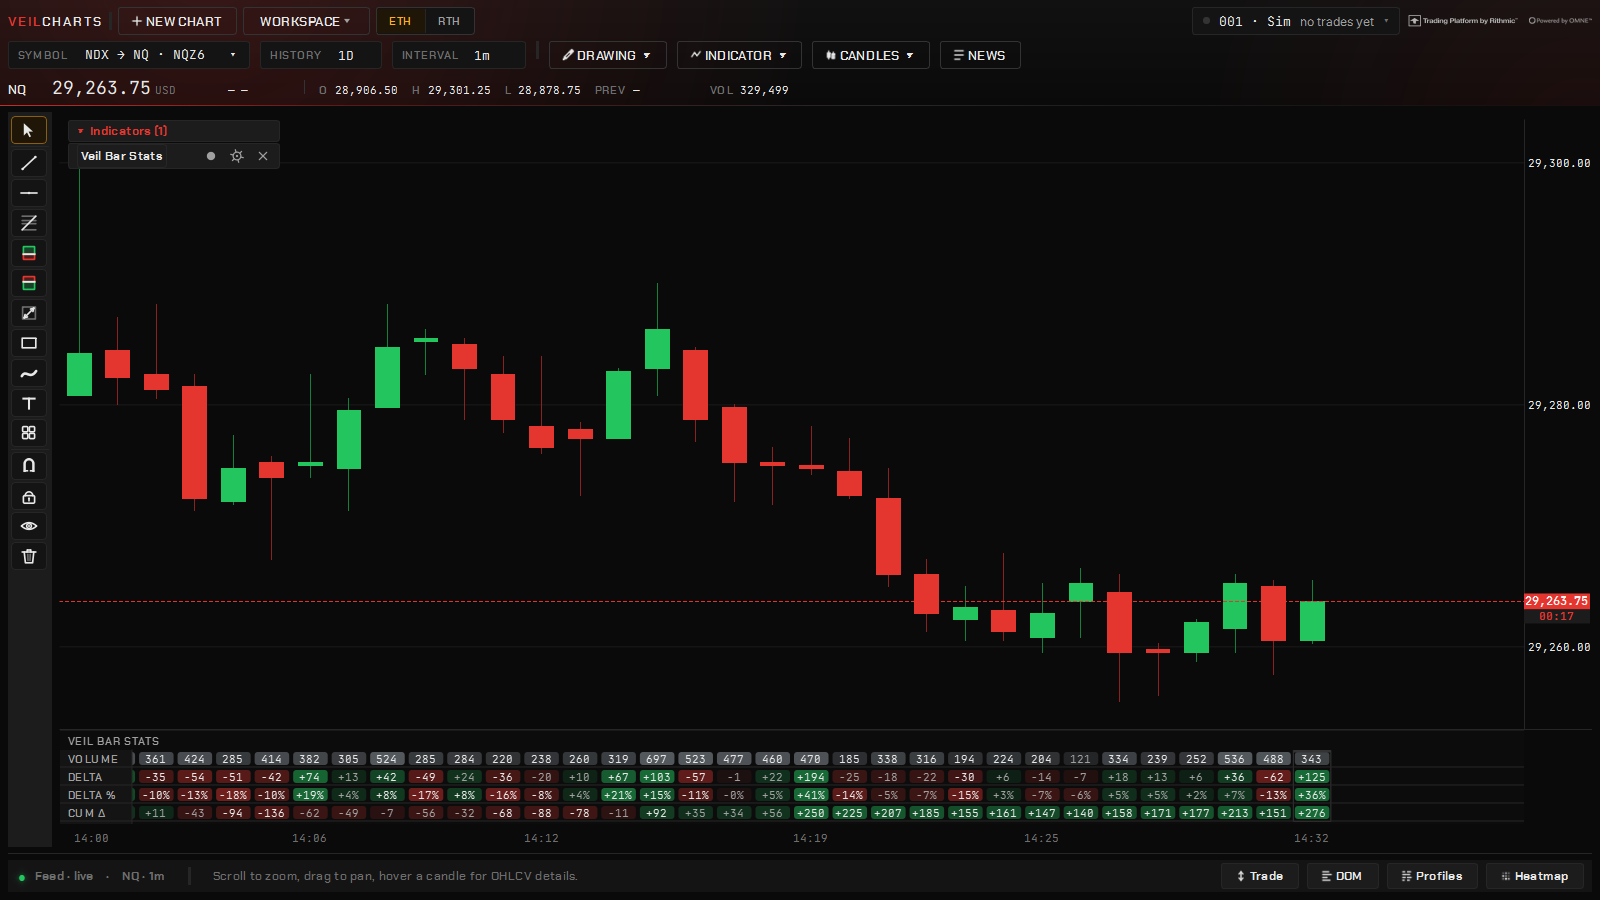
Veil Bar Stats under a one-minute chart: volume, delta, delta % and cumulative delta as tiles, one column per bar. Real NQ tape, recorded through Rithmic in September 2026 — shown to illustrate the software, not a forecast or a trading recommendation. Chartveil does not provide or resell market data.
A table under the chart with one column per bar — volume, delta, cumulative delta, the extremes and whichever rows you switch on — as tiles in the same mono digits as the footprint cells, tinted by intensity, with the live bar outlined and the crosshair’s column washed. It keeps up when you zoom all the way out. Indicator ▾ → Volume & Order Flow → Veil Bar Stats.
Reading the shapes
A negative delta node at a high means sellers were the aggressors into that level and price held there anyway — which usually means passive buyers absorbed them. Absorption at a high is a different signal from buying at a high.
The profile shows where trades happened; the heatmap shows where orders are waiting. Read them together.
Studies
Managing studies
Adding, adjusting, hiding and removing studies; scaling their panes; and saving a setup as a template so every new chart starts where you want it.
Adding a study
The study picker under the Indicator button, grouped by section; click a study and it is on the chart. Real NQ tape, recorded through Rithmic in September 2026 — shown to illustrate the software, not a forecast or a trading recommendation. Chartveil does not provide or resell market data.
The Indicator ▾ button in the chart header opens the picker, grouped into:
Click a study and it is on the chart. Type in the picker’s search box to find one by name.
The legend
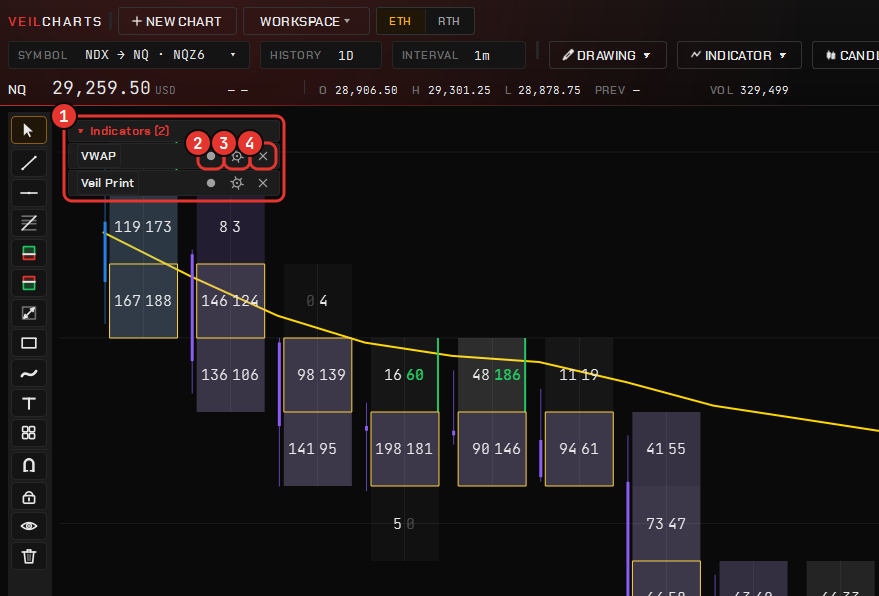
1 The legend lists every study on the chart · 2 hide or show it · 3 open its settings · 4 remove it. Real NQ tape, recorded through Rithmic in September 2026 — shown to illustrate the software, not a forecast or a trading recommendation. Chartveil does not provide or resell market data.
Every study you have added is listed in the legend at the top-left of the chart. That is where you:
open its settings (click the study’s name, or the gear);
hide it without removing it (the eye);
remove it (the ×).
Right-click the chart → Studies on this chart lists the same things.
Panes
Studies that draw in their own pane — delta, CVD, the oscillators, Bar Stats — share the chart’s crosshair. Each pane is mouse-scaled:
To
Do
Move the pane’s scale
Drag the pane’s body
Zoom the pane
Drag its own axis
Refit
Double-click its axis
Back to automatic pane sizing
Double-click the divider under the pane
An auto-focus pill appears when you have wandered off the data and brings it back in one click. Delta and CVD scale three ways — automatic, symmetric around zero, or a manual range — from their settings.
Indicator templates
Once a study is set the way you like, save the settings as a named template from its settings dialog. Mark one template as the default and every new copy of that study starts from it, on every chart — so a footprint tuned for NQ does not have to be tuned again on the next window. Templates are saved in your config folder with the rest of your settings and travel with a copied config.
Cost
A study that reads ticks — Veil Print, the profiles, Bar Stats — costs more than one that reads bars. The knobs that matter when a chart feels heavy: the number of profiles shown, how many heatmap windows are open, and how far back a tick study reaches. A custom indicator that measures over 25 ms a bar is moved to a worker thread, paused after three failures and stopped at 512 MB, so a slow indicator of your own cannot take the platform with it.
Studies
The Veil studies
The order-flow and structure studies that are Chartveil's own — delta, CVD, big prints, sessions, VWAP, the book on the chart, levels, divergence and the calendar.
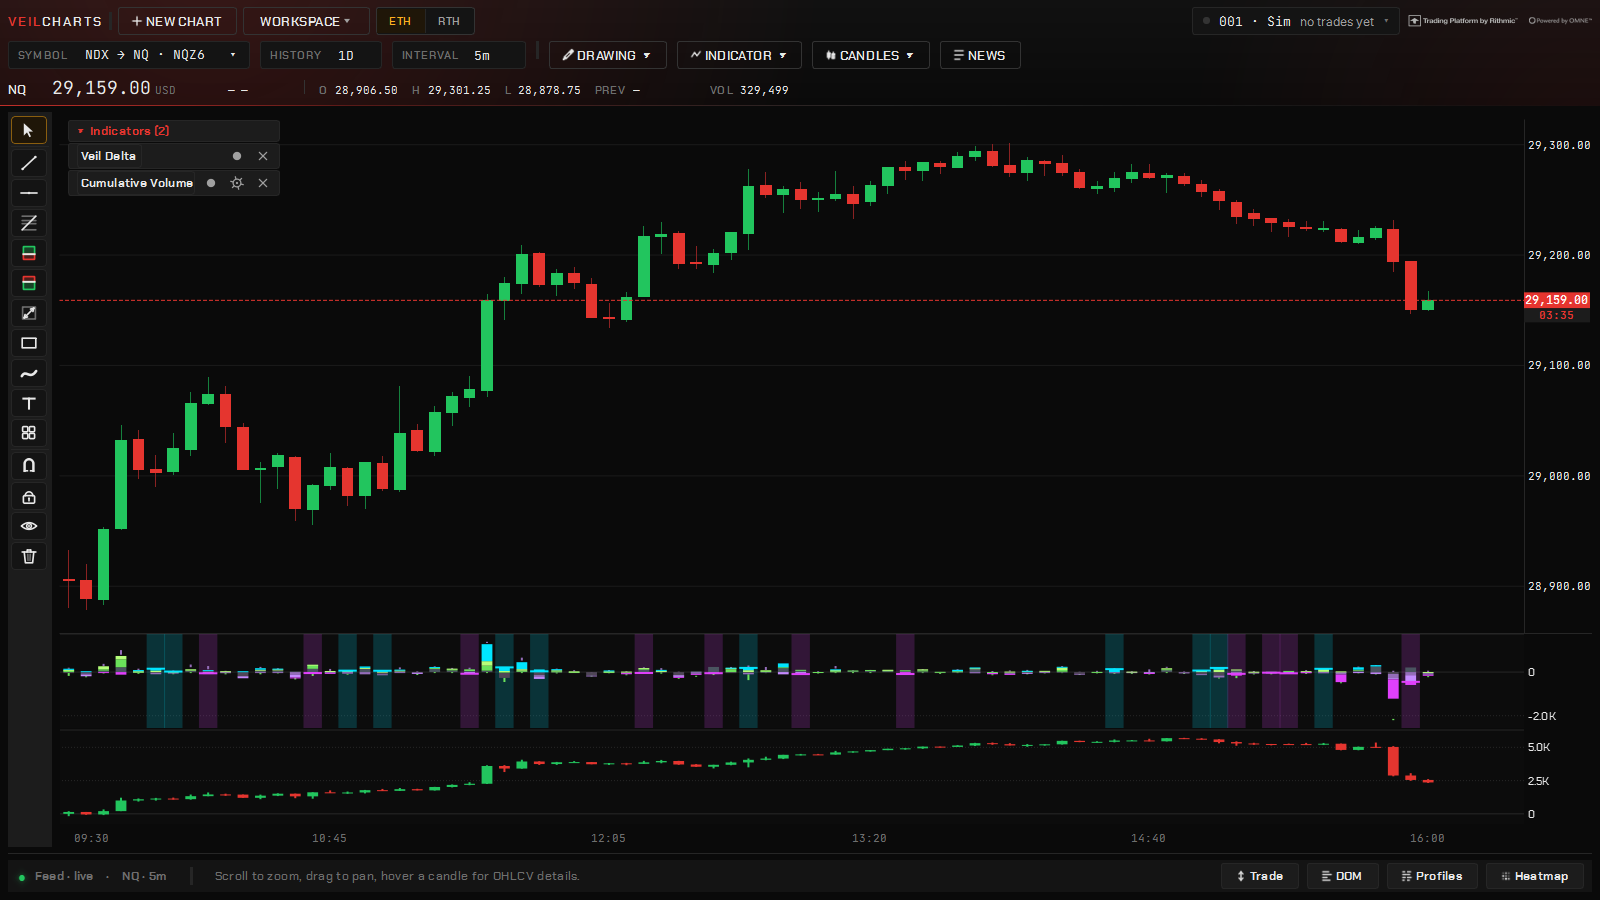
Veil Delta (per-bar delta with its intra-bar extremes) and Cumulative Volume Delta in their own panes under a 5-minute chart Real NQ tape, recorded through Rithmic in September 2026 — shown to illustrate the software, not a forecast or a trading recommendation. Chartveil does not provide or resell market data.
Every study named Veil is built in-house on the shared tape and lives in the picker’s Volume & Order Flow section. Veil Print and Veil Profiles have chapters of their own — Veil Print, Profiles — and the gamma studies are under Dealer positioning. The rest are here.
Veil Delta and Cumulative Volume Delta
Veil Delta is a pane of per-bar delta — buying minus selling, bar by bar. Cumulative Volume Delta runs the total across the session, which is where divergence lives: a higher high in price on a lower high in CVD says the push had less aggression behind it than the last one — a common thing to look for, and a common thing to over-read.
Both panes scale three ways — automatic, symmetric around zero, or a manual range — and like every pane you can drag the body to move it, drag its own axis to zoom it, and double-click the axis to refit. CVD resets at the 18:00 ET session, the New York open or rolling; the heatmap’s CVD band uses the same choices.
Veil Trades and Veil Grouped Trades
Veil Trades draws the largest individual executions as bubbles at the price and moment they happened, sized by contracts. One 80-contract print is information; the same size spread across forty small prints is noise, and this study only shows you the former. The filter is automatic by default — it adapts to what counts as large on the instrument that day — or set a manual floor and ceiling when you only want a specific size band. The floor is shared with the heatmap’s bubbles and Time & Sales.
Veil Grouped Trades reassembles a burst of fills milliseconds apart into one bubble per aggressive order, so a 150-contract sweep reads as a 150-contract decision instead of a scatter of fragments.
Veil Bar Stats, Veil Candle Stats
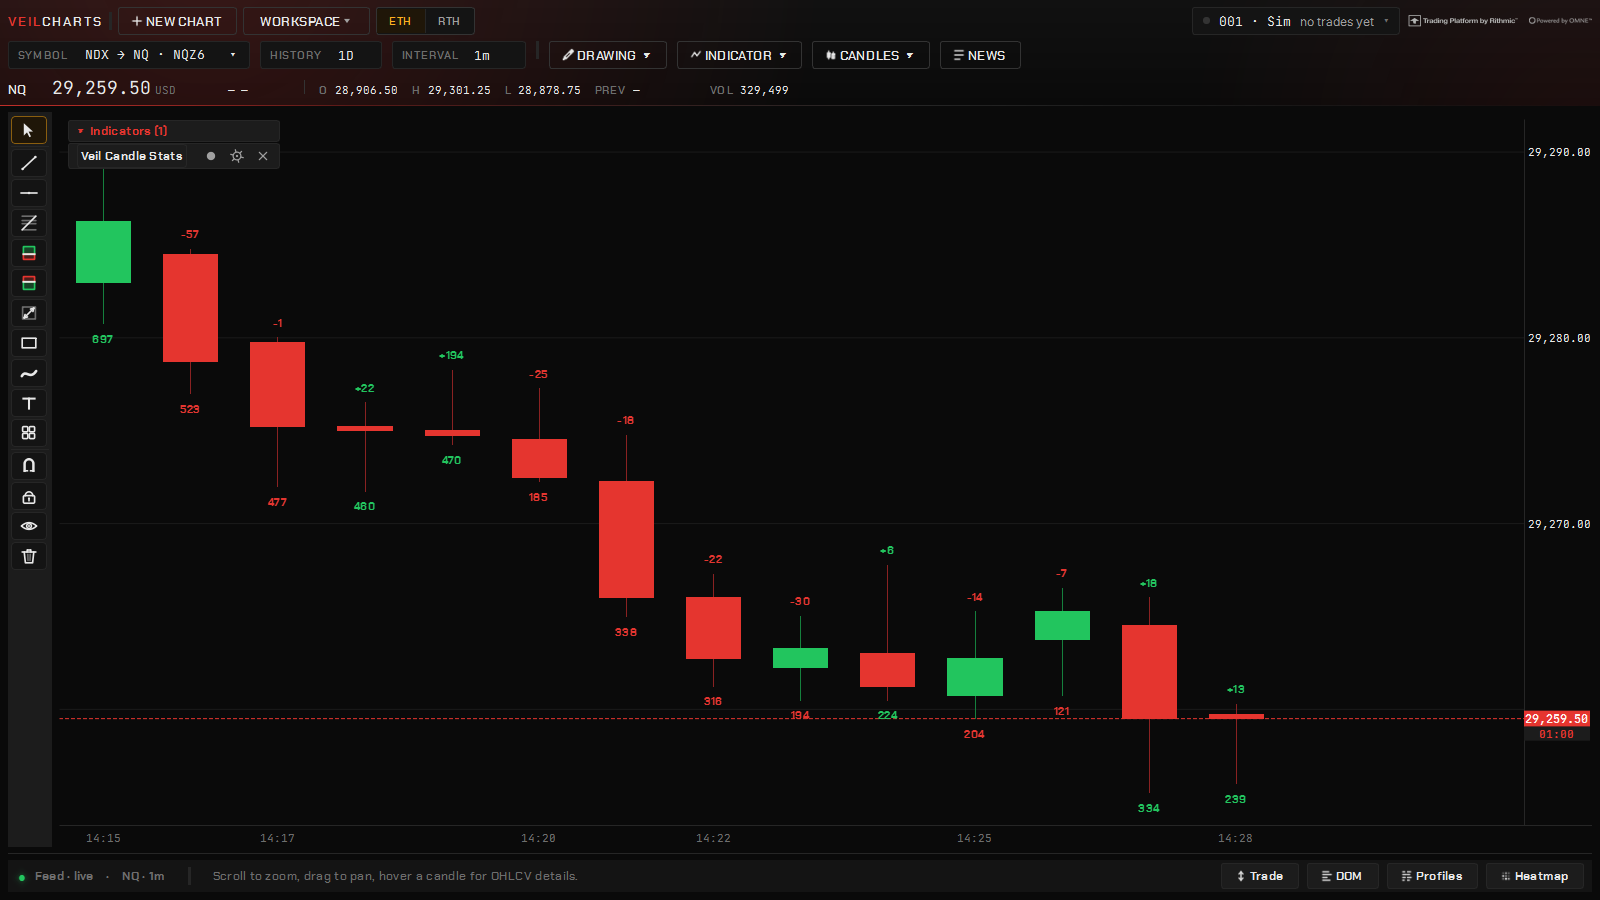
Veil Candle Stats: delta above each candle and volume below it, coloured by delta sign. Real NQ tape, recorded through Rithmic in September 2026 — shown to illustrate the software, not a forecast or a trading recommendation. Chartveil does not provide or resell market data.
Three readouts of the same per-bar numbers. Veil Bar Stats is the table under the chart — see Profiles. Veil Candle Stats prints two of the numbers on the candles themselves — one field above the high and one below the low (delta above, volume below by default), coloured by delta sign, hidden automatically when the candles are too narrow to carry them.
Veil Depth and Veil Depth of Market
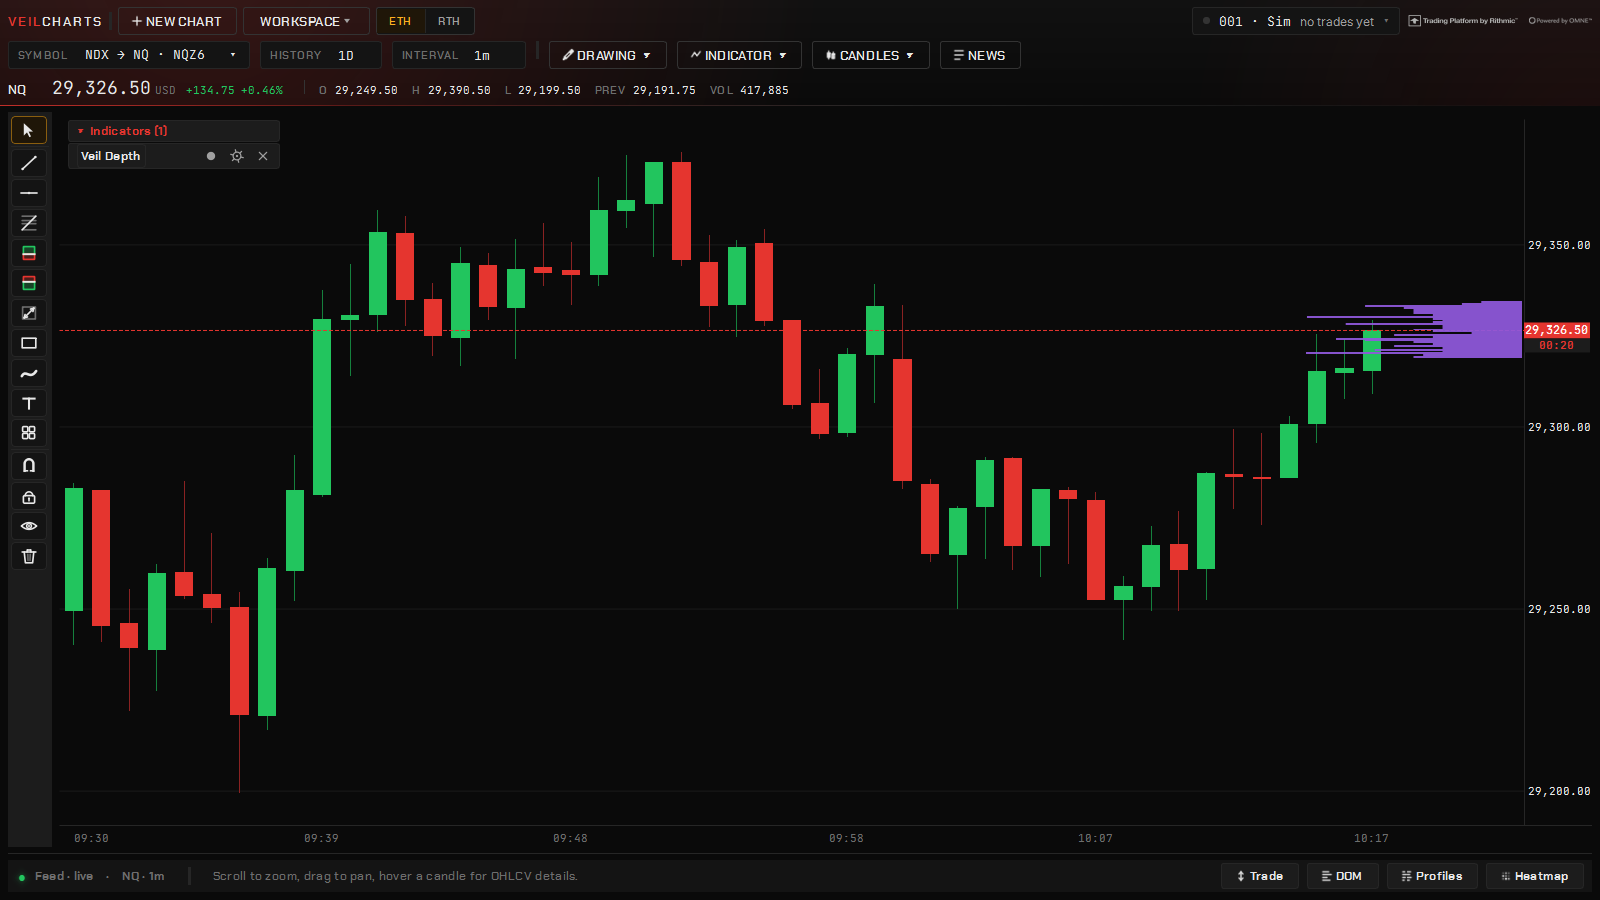
Veil Depth: the resting book as bars at the chart’s edge, bids below and asks above the last price. Real NQ tape, recorded through Rithmic in September 2026 — shown to illustrate the software, not a forecast or a trading recommendation. Chartveil does not provide or resell market data.
Two ways to put the book on the chart:
Veil Depth — the book as it stands right now, as bars at the chart’s edge, one per level, drawn the way the heatmap’s ladder draws them: tiled rows, the size printed on the bar, the heaviest levels lit. Settings: how far above and below the last price to look, a per-level contract filter, the column width, and what the rows print (total, biggest × total, or nothing).
Veil Depth of Market — the heatmap on the candles: every resting limit order the book has shown while the session recorded, painted at its price and the time it rested there, straight over the bars that traded through it. One colour per side; a level’s size is carried by how solid and thick its band is. Only levels at or above the minimum size (15 contracts by default) produce heat, and the filter bites per level, so a cluster of small orders can never sum its way past it. A ladder against the price scale prints biggest × total, the biggest level per side boxed.
Both need Level 2.
VWAP with deviation bands
Volume-weighted average price, anchored to the trading day or to the New York cash session, with ±1σ, 2σ and 3σ bands computed volume-weighted rather than eyeballed. The same engine draws it on the chart and on the heatmap, so the two never disagree about where it is. For a VWAP anchored to a bar of your choosing, with resets, see Drawing tools.
Sessions
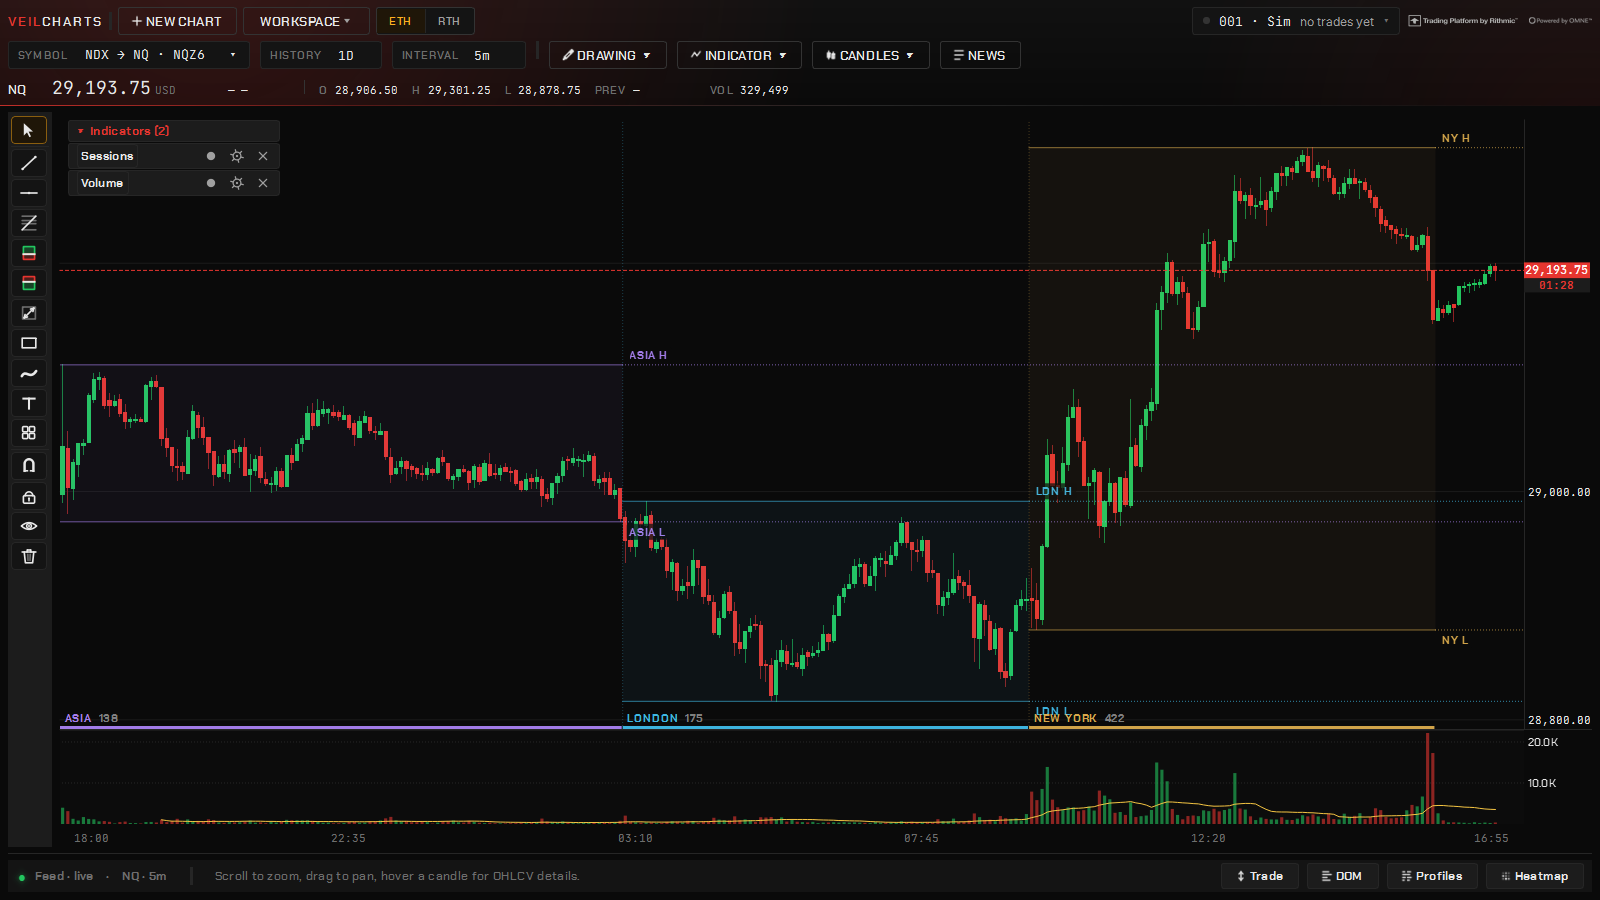
Sessions: Asia, London and New York as blocks with a rail along the bottom, each session’s high and low carried forward. Real NQ tape, recorded through Rithmic in September 2026 — shown to illustrate the software, not a forecast or a trading recommendation. Chartveil does not provide or resell market data.
Asia, London and New York — and one custom window — on the chart as a rail along the bottom in each session’s colour, so which desk is on reads like a timeline and never touches a candle. Each session’s high and low are carried forward as levels, its hours are echoed in the label, and a clock chip says which session is open and for how much longer. History is counted in days, so the rail reads the same on a one-minute chart and a fifteen.
Veil Levels
The reference prices a day is traded against, as rails across the session they apply to and labelled on the price scale: the previous day’s high, low, mid and close; the previous cash session’s VAH, VAL and POC (the open-drive read — did we open in or out of yesterday’s value? — is made against exactly these); the previous full electronic session’s value area; the overnight high and low, drawn from the cash open onward, which is when they stop moving and start being levels; and the day’s own developing high and low. Each level is an independent switch with its own colour. Several of them can be alerts.
ADR Levels
Average daily range, projected as levels from the day’s open — recomputed per day from that day’s trailing range history (14- and 7-day look-backs by default), so the boxes step from day to day. When the day has already travelled its average range, continuation is statistically the harder trade; these levels put that fact on the chart.
Structure
A market-structure overlay: ZigZag swings confirmed by an EMA-pullback rule, so the structure of a leg and the highs and lows that matter read at a glance, with the swing points labelled. Context for where price is in a range and which way it is leaning.
Veil SMT Divergence
The two index futures usually move together. When one makes a new high or low and its sibling refuses to confirm it, that disagreement — smart-money divergence — is marked on the chart automatically: bearish at swing highs, bullish at swing lows. It is context for a level, not a signal on its own.
Veil QQQ Levels
The whole-dollar QQQ ladder — 700, 701, 702… — drawn on an NQ chart at its NQ equivalent, and SPY’s on ES, through one held ratio that steps only when the smoothed live ratio has really moved, so the levels sit still instead of shivering with every quote. The ratio is printed on the chart and kept between sessions; the study can also carry your own QQQ numbers and QQQ’s prior close, open and day range. The lock mode — steady, session lock, live or fixed — is a setting.
Veil RSI Candles
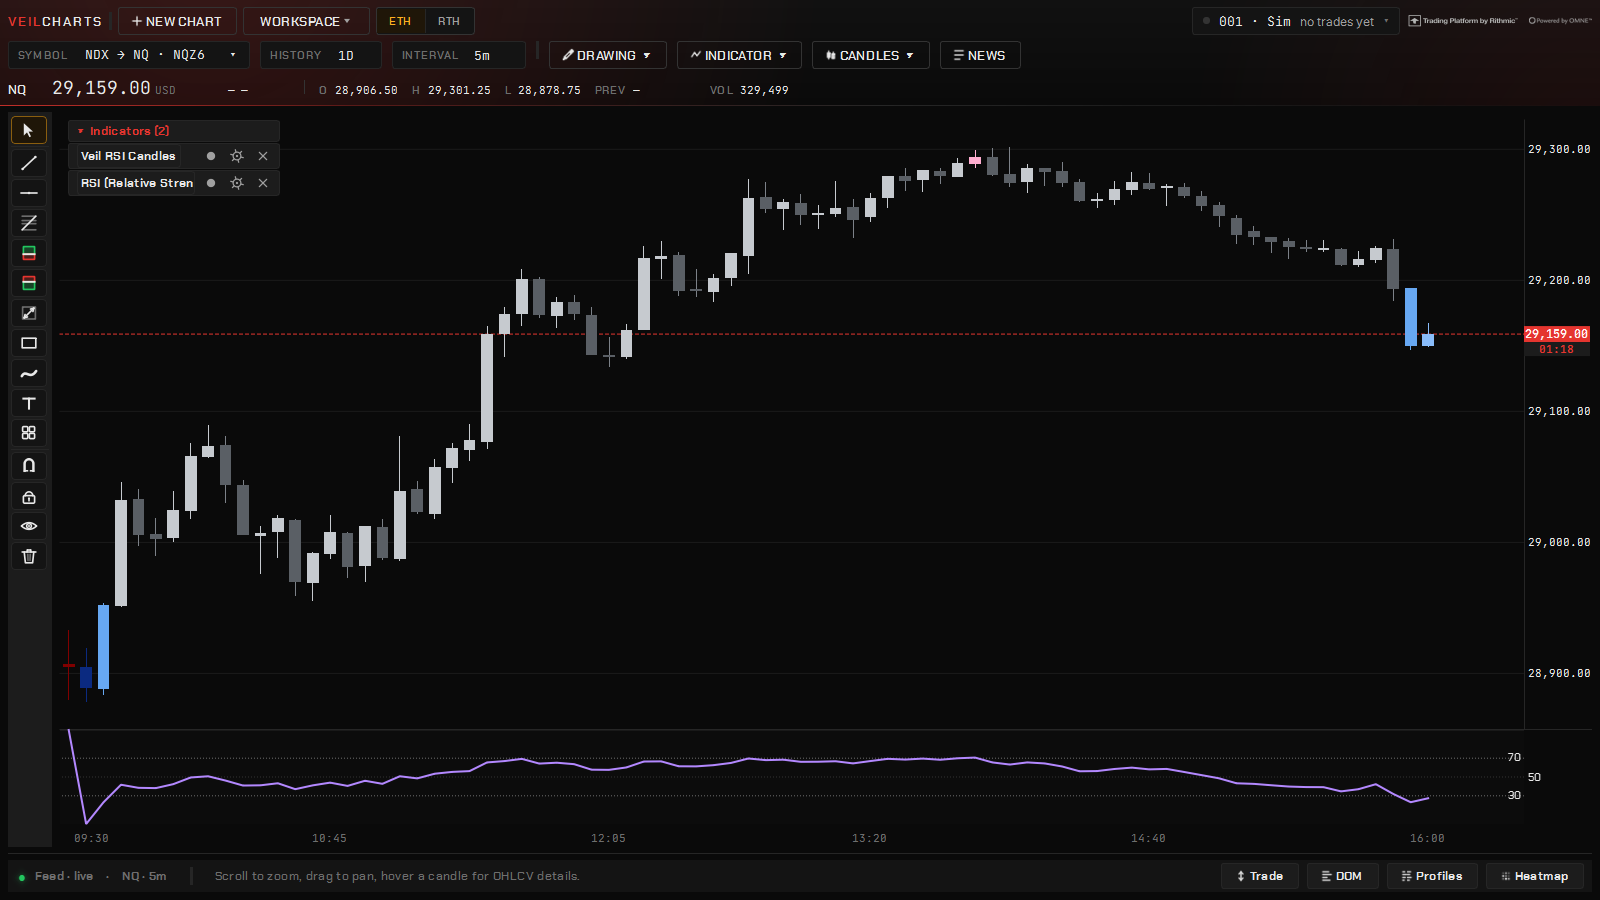
Veil RSI Candles with the RSI pane beneath: neutral bars in mono, the oversold bars lit. Real NQ tape, recorded through Rithmic in September 2026 — shown to illustrate the software, not a forecast or a trading recommendation. Chartveil does not provide or resell market data.
The bars repainted by where RSI sits: overbought bars (RSI ≥ 70 by default) in one ramp, oversold bars (≤ 30) in another, body, wick and border all taking the one colour so a hot bar reads at a glance; every other bar is left neutral.
Veil Economic Events
Scheduled macro releases — CPI, NFP, FOMC and the rest — drawn as markers at the minute they print, with upcoming events projected into the right margin. Date confidence is honest: a confirmed date draws solid, an estimated one draws dashed with a ?, and nothing is extrapolated past what is published. The schedule works offline. Add a free statistics key under Chart settings → Data and past markers also carry the actual and previous prints as they were first published. The same calendar drives the News pane.
Studies
Standard indicators
Moving averages, Bollinger Bands, VWAP, RSI, MACD, Stochastic, ATR and Volume — the standards, done properly.
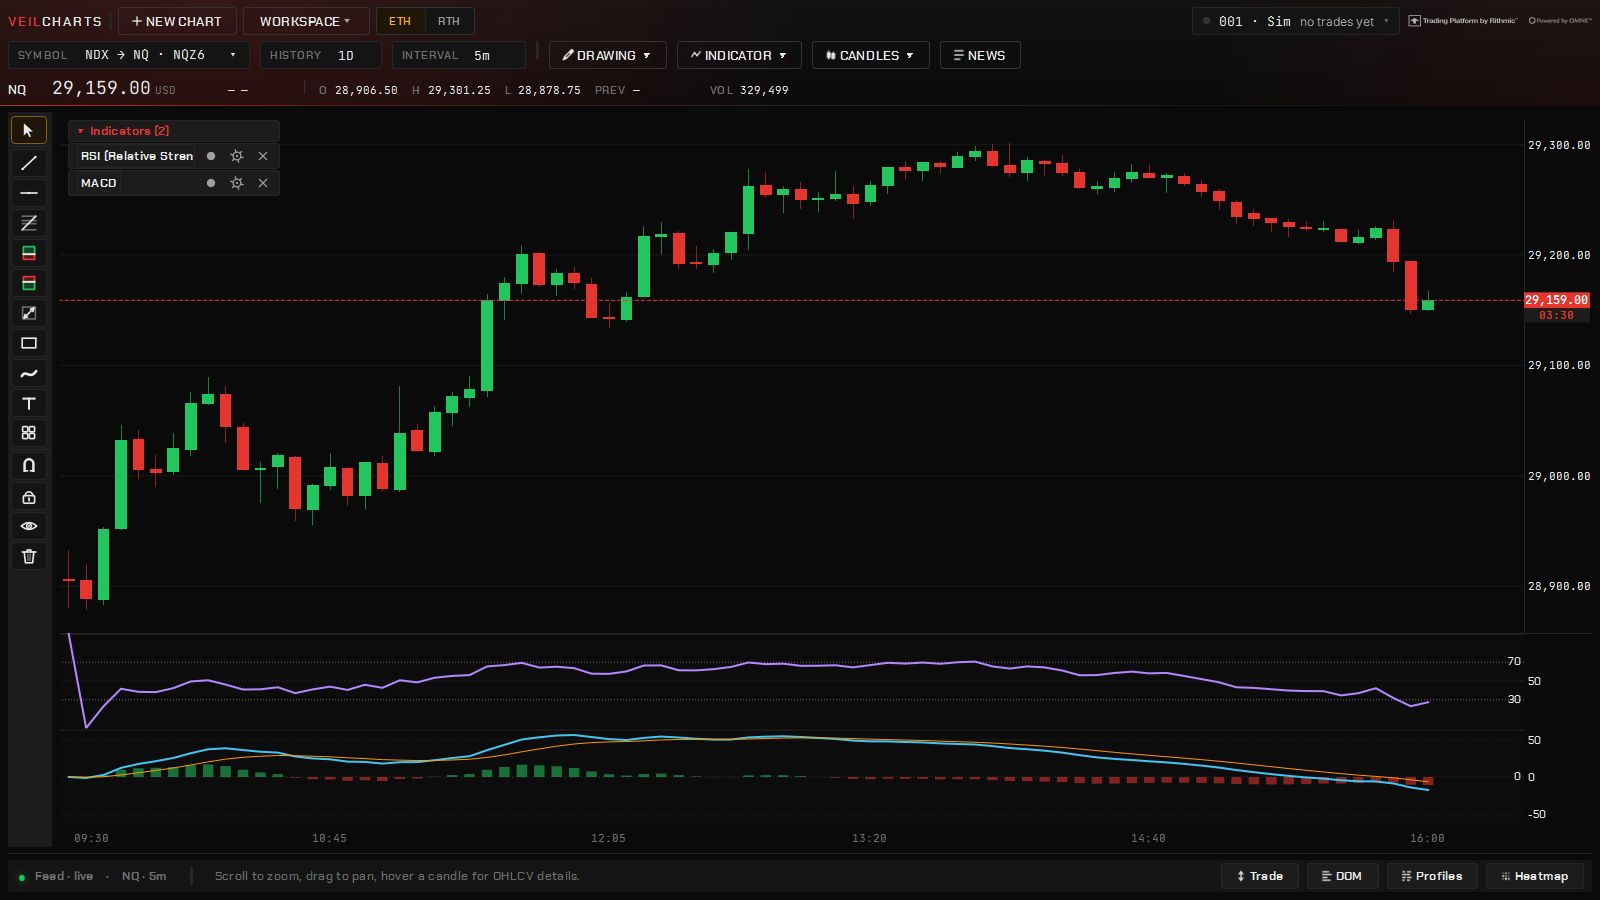
RSI and MACD in their own panes under a 5-minute chart Real NQ tape, recorded through Rithmic in September 2026 — shown to illustrate the software, not a forecast or a trading recommendation. Chartveil does not provide or resell market data.
The standards are all here. They read the chart’s bars — whatever bar type is on it — and the oscillators draw in their own panes, sharing the chart’s crosshair.
Moving Average
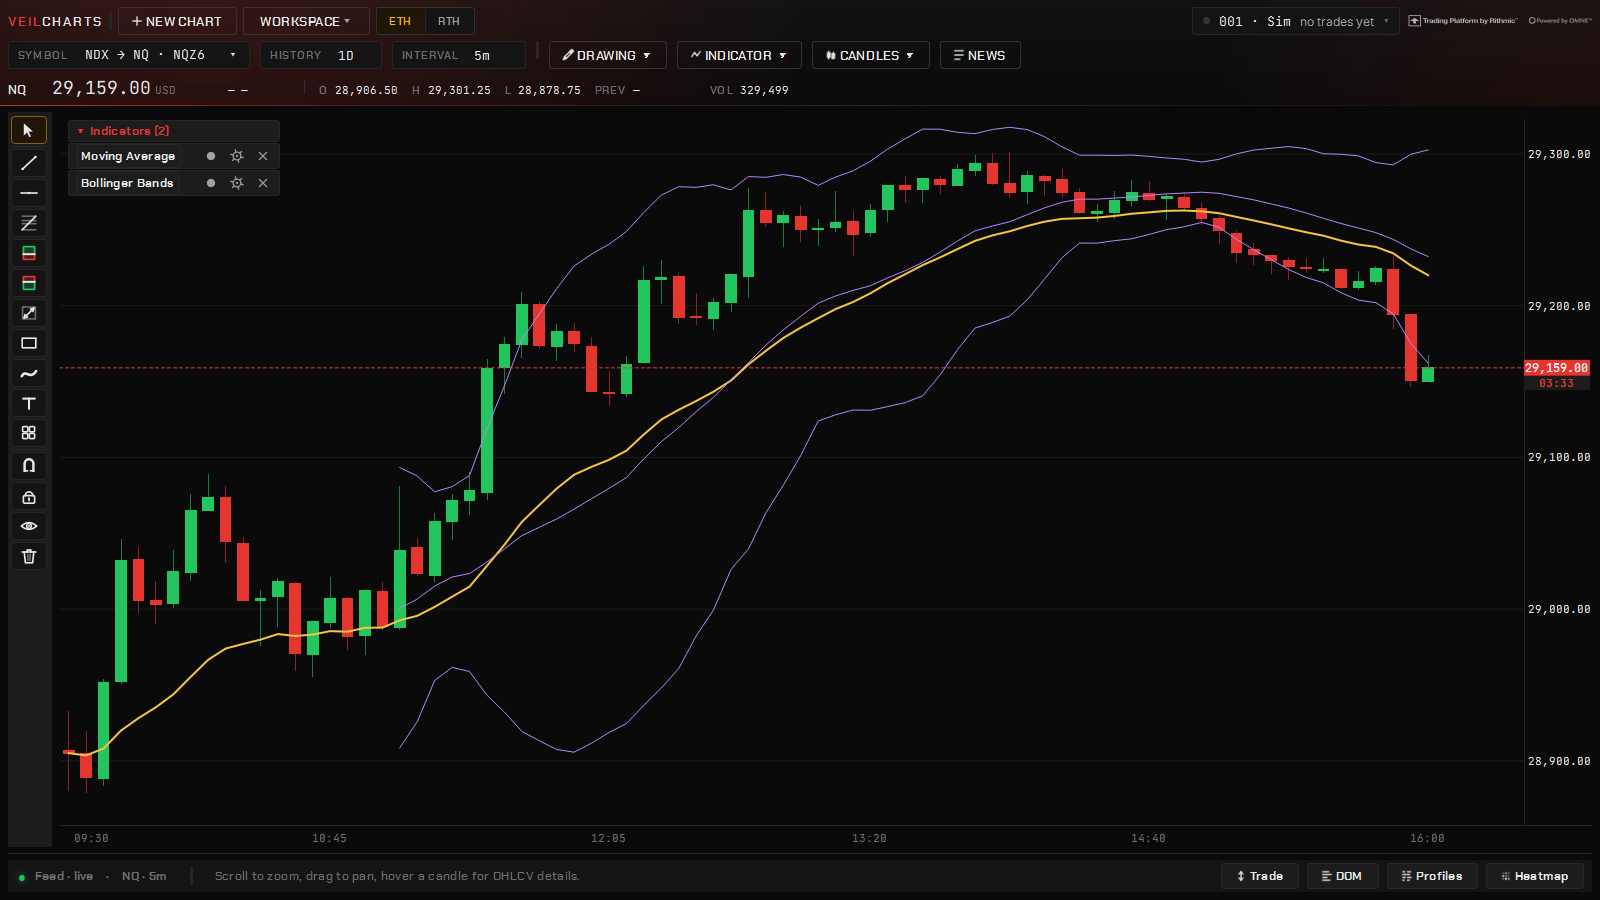
A 20-period EMA with Bollinger Bands on a 5-minute chart. Real NQ tape, recorded through Rithmic in September 2026 — shown to illustrate the software, not a forecast or a trading recommendation. Chartveil does not provide or resell market data.
One study with fourteen types: SMA, EMA, WMA, Wilder’s RMA, Hull, DEMA, TEMA, triangular, VWMA, ALMA, least squares, Kaufman adaptive, zero-lag EMA and Tillson T3. Set the length and the source, and switch on trend colouring to tint the line by its slope. Add the study twice for a fast and a slow line.
Bollinger Bands
A moving average with bands a set number of standard deviations either side. Length, multiplier and the average type are settings.
VWAP
The session VWAP with volume-weighted deviation bands — described under the Veil studies. It is listed under Basic Indicators in the picker.
Oscillators
Study
What it shows
RSI
Relative strength over a length, with the overbought and oversold lines
MACD
The fast and slow EMA difference, its signal line and the histogram
Stochastic
%K and %D over a look-back
ATR
Average true range — the size of a bar’s travel, useful for stop distances in ticks
Volume
Volume per bar, coloured by bar direction, with an optional volume moving average
Every oscillator pane is mouse-scaled: drag to move, drag its axis to zoom, double-click to refit, and an auto-focus pill brings it back when you wander. See Managing studies.
Alerts on a study
Any study’s output can be an alert — its value against a number, crossing up or down. Right-click the chart → Alert at… and pick the study. See Alerts.
Dealer positioning
VeilGEX
Dealer gamma exposure by strike on SPX and NDX — the flip, the walls, the expected move — read in the contract you trade.
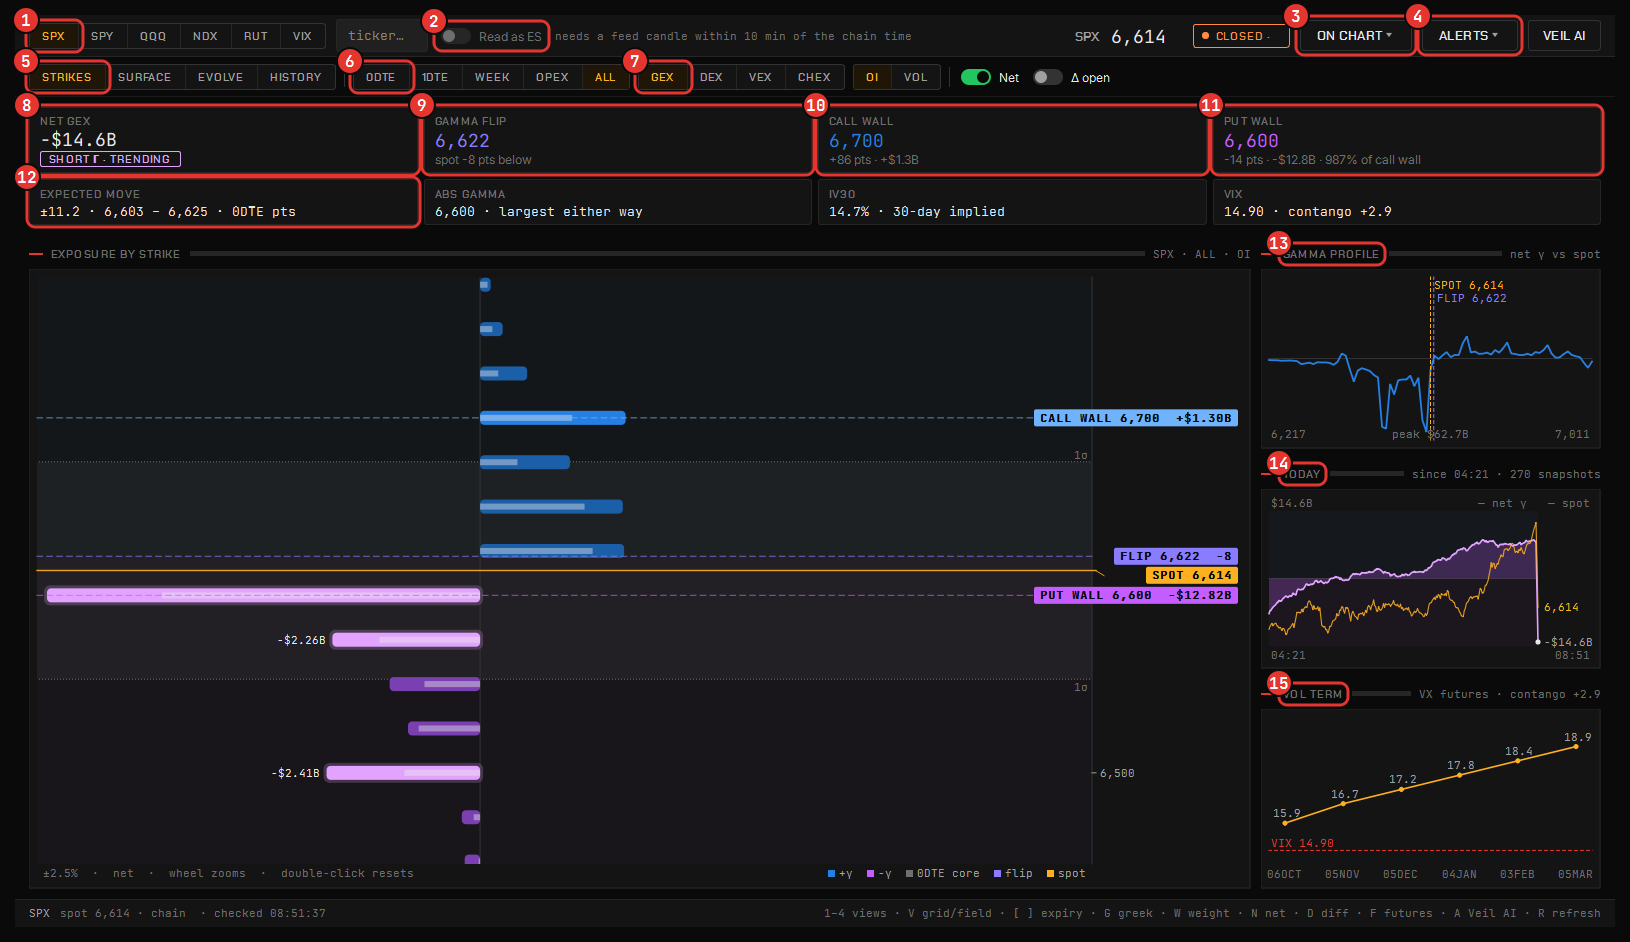
The VeilGEX window. 1 the index · 2 Read as ES · 3 On chart · 4 Alerts · 5 Strikes view · 6 expiry · 7 greek · 8 Net GEX and the regime · 9 flip · 10 call wall · 11 put wall · 12 expected move · 13 gamma profile · 14 TODAY · 15 vol term. Generated data, for illustration — not market data, a forecast or a trading recommendation.
VeilGEX shows dealer gamma exposure by strike on SPX and NDX — the indices behind the futures the rest of the platform is built for — with the flip point, the call and put walls, vanna and charm, the expected move and the volatility curve. Heavy positive gamma tends to damp movement as dealers hedge against it; past the flip it amplifies.
Note
GEX is context about positioning, not a signal. Chartveil does not issue signals or advice, and gamma exposure is an input to your own read, not a substitute for one.
Data
The terminal retrieves delayed options-chain data itself, so nothing extra is needed. Positioning is context that develops over hours, so delayed data carries it honestly. If you already pay an options-data provider, paste its key under Data feed → Options data and the window uses that instead. The header says in words whether the chain it is showing is realtime, delayed, or the last one taken before the market closed and when, so a holiday never reads like a live session.
The window
Open it from the Command Center’s VeilGEX tile, or as a tile on the Veil Desk.
Row 1 — the subject. The symbol (SPX or NDX), the ticker, Read as NQ / ES with the basis, the spot, the data chip, On chart ▾, Alerts ▾ and the Veil AI toggle.
Row 2 — the view, and only that view’s controls:
View
Shows
Strikes
Exposure per strike as a field that scales to the book, with the flip, the walls and the ranked strikes tagged
Surface
Strikes across expiries — as a grid or a field — with an expiry picker, the greek (GEX, DEX, VEX, CHEX), the weighting, net or Δ since the open
Evolve
How the surface has moved through the day, grid or field, with a Diff mode and a day opener
History
Net GEX day by day over a range, with the DIX switch
Tiles — one height, three lines each: NET GEX with the regime, FLIP, CALL WALL, PUT WALL, ABS γ, EXP MOVE, IV30 and VIX.
Right of the view — the gamma profile, the TODAY sidebar (today’s expiry on its own) and the vol term structure. The Veil AI dock opens beside it when toggled, primed with what is on screen.
Footer — symbol, spot, chain time, last check, and the keyboard map.
Read as NQ / ES
One switch re-expresses every strike, wall and flip point as NQ or ES instead of the index, using the time-matched basis between the future and the index — measured over the last regular-hours minutes, so the levels sit still across a timeframe change and read correctly overnight, when index cash is frozen. The index strike stays beside the translated one. The switch is disabled, with the reason, when no feed candle lands within ten minutes of the chain time.
Putting the levels on a chart
On chart ▾ puts the flip and the walls on an NQ or ES chart. The chart-side studies — Gamma Profile, Gamma Heatmap, GEX Levels, Option Profile and the rest — are described in Gamma studies; every one of them reads the options book the chart header names.
Alerts
Alerts ▾ arms an alert when price crosses a wall or the flip, or when the flip itself moves by more than a set number of index points. See Alerts.
On the desk
On the Veil Desk VeilGEX shows a compact face in a small tile — Strikes, Surface (grid or field), Evolve (grid or field) or History, your pick from the picker on the compact face — and the full dashboard when the tile has room. The bar folds its expiry and view into the symbol menu before anything is clipped.
One grammar
Positive gamma in blues, negative in purples, the flip in its own violet, spot in amber — the same three-step ramp, the same tag anatomy and the same regime pill in the window, on the chart studies, on the heatmap and on the ladder, so a level learned in one place reads the same in every other.
Dealer positioning
Gamma studies on the chart
The picker's Gamma DP section — exposure as terrain, as a heatmap, as a ledger of levels, and the options book itself, all on the chart you are already reading.
The chart picker’s Gamma DP section holds the dealer-positioning studies. They draw on NQ and ES charts, because those are the futures the index options price; on any other chart they say so rather than drawing nothing. All of them share the VeilGEX grammar.
Which options book the chart reads
The chart header carries a chip naming the options book its dealer-positioning studies are built from — NDX or QQQ on an NQ chart, SPX or SPY on ES. Click it to switch, and every gamma study on that chart follows the pick. The basis between the index and the future is measured over the last regular-hours minutes, so the levels sit still across a timeframe change and read correctly overnight.
Veil Gamma Profile
Exposure per strike as terrain at the chart edge: three tiers of colour by share of the visible peak, values at the bar tip, CALL WALL and PUT WALL tags with points-from-spot, the flip as a tick, a square-root scale for a lopsided book, a ±1σ band, and today’s expiry drawn as a core inside every bar. The heaviest-gamma strike is tagged as the magnet.
Veil Gamma Heatmap
Exposure by strike across time. Strikes are binned uniformly and summed so a five-point chain never stacks into fog; the ramp keeps the whole book visible with the heaviest cells lit. Auto reads today’s expiry on a futures chart; the change modes show what was added and removed since the open or over the last N minutes. Rows are straight, tags name the levels at the newest column, and a hover card gives the numbers.
Veil GEX Levels
The levels on the chart as a ledger: every one a row with its name, price and size, tiered by weight, with markers at the chart edge, a regime strip, how many days a wall has held, and an alert when price crosses a wall or the flip. Joined runs show where a level has been the same strike day after day.
Veil Option Profile
Open interest and volume by strike pinned to the chart edge, rows anchored on their strikes, expiry ink nesting today inside the week inside the month, a rail of level chips — ATM, max pain, the heaviest-gamma strike, the expected move — open interest plus what has traded today, the change in open interest since the prior session with an unusual mark where it is several times the strike’s average, and a strike-by-expiry grid. Click the header to change what the rows show: volume against open interest, premium, or a compare mode.
Veil Gamma Bands
The band the options market is pricing, drawn through time: one expected move — roughly the front-expiry ATM straddle — around an anchor. Inside it, the session is doing what it was priced to do; a close outside is the day exceeding its own option pricing.
Veil Gamma Envelopes
The call wall, the put wall and the flip plotted through time as stepped series across every recorded minute of every recorded session, so the chart shows where the walls sat — and when they migrated — while price was trading against them. An optional two-tone wash between the walls splits at the flip.
Veil Gamma Regime
The session’s net dealer gamma as a sub-pane oscillator of signed bars against a hard zero line, with an optional regime wash behind the candles. Above zero the book is long gamma and hedging leans against the move; below zero it goes with it. The sign is the read; the wash only ever encodes the sign and how far past a threshold it sits.
Veil Option Flows
Large options prints marked on the chart at the strike they hit and the minute they hit it: a diamond for a call, a square for a put, sized by premium, with the side, days to expiry and an aggressor estimate on hover.
Veil Options Delta
A sub-pane histogram of the net options delta traded on the chart’s underlying index — per bar, or as a running total across the session. Sustained positive readings mean call-side pressure building through the day; negative, put-side.
Veil Options Volume
How much options business actually traded, minute by minute, split call against put — the participation number the exposure studies never show. A wall that holds while nothing trades into it is inertia; the same wall holding through a volume surge is a fight. The pane prints the running put/call ratio in its header, on contracts or on premium.
Veil QQQ Levels
Listed under Volume & Order Flow rather than Gamma DP, but it belongs to the same family: the whole-dollar QQQ ladder on an NQ chart, SPY’s on ES, through one held ratio. See The Veil studies.
Trading
Accounts & the simulator
Broker accounts read back from your firm; simulated accounts that carry a funded program's rule book so you can rehearse the exact account you plan to trade.
Chartveil trades two kinds of account, and the ticket always says which:
A broker account — orders route to your own firm through your own credentials, and positions and P&L read back from the firm, so the platform shows the same numbers your account does.
A simulated account — fills come from the built-in simulator: real prices, simulated fills, for practising execution and running prop-style rules without real risk. Every simulated account carries “Sim” in its name on purpose, so a screenshot of a ticket can never pass as a funded result.
Chartveil is the interface, not the counterparty. It is not a broker, holds no funds, and every order sent from your account is yours.
Broker accounts
They arrive with the feed login: connect, and the accounts your firm has put on that login appear in the Command Center’s Accounts tab and on the ticket’s account menu. There is nothing to add by hand. The account number is what the broker calls the account; passwords live in the sealed connection store and are never asked for here.
Warning
Confirm with your firm that trading through a third-party platform is allowed on the account you mean to use, and especially before placing live orders on a funded account with platform restrictions. Their rules, not ours, decide.
Simulated accounts
A new practice account with the end-of-day trailing preset: drawdown, daily loss and the program gates, every number editable.
Accounts → Add account creates one. Give it a starting balance and, if you want, a rule book:
Preset
Shape
No rules
A plain practice account. Nothing is enforced.
Evaluation · intraday trailing drawdown
The strict marking: the floor follows your peak equity including open profit, tick by tick, and keeps whatever ground it takes.
Evaluation · end-of-day trailing drawdown
The forgiving marking: the floor is recalculated once a day from your closing balance, so an intraday dip that closes green costs nothing.
Funded · static drawdown + consistency
A fixed floor that never trails, no profit target, and a payout gate — no single day may be more than a set share of total profit.
Every number stays editable, because the only figures that matter are the ones on your own firm’s dashboard. Any amount can be typed as dollars (2500) or as a share of the account (5%); the hint under the field shows the other unit live.
The rules an account can carry:
Drawdown — the floor, how it is marked (intraday trailing, end-of-day trailing, or static), whether it locks once it reaches the starting balance, and what happens on breach: fail the account.
Daily loss — on equity or on realised only, and on breach flatten and lock the day.
Profit target, max contracts, flat by time, consistency (reported, never enforced — it delays a payout, it does not close an account) and minimum trading days.
Breach a rule and the account locks or fails exactly as the real program would; hit the target and it tells you. The simulator runs the same ticket, the same chart trading and the same Risk Manager on live prices, so the first time you drag a stop is not with money behind it.
Which account is the ticket on
The account menu on the ticket picks it, per chart. The trade chip in the chart header names it; a live account puts a red edge on the strip and asks for one confirmation per window before the first order leaves. A docked ladder trades through its chart’s ticket.
Several accounts at once
Run several accounts side by side, each with its own book and its own rule set. The Trade Copier mirrors one onto the others; the journal can combine any set of them into one record. The Risk Manager is one rule book over all of them.
Trading
The order ticket & chart trading
Market, limit, stop and stop-limit orders priced by clicking the chart; your position on the bars with draggable stop and target; chart one contract and trade its sibling.
The ticket docks beside the chart. Which book an order goes to is decided by the account picked on it: a simulated account fills in the local simulator; a live broker account routes through your firm. The panel shows Open Qty, Open P&L and Daily P&L, then the buy/sell ticket and the bracket section.
Before your first live order
A short list, in the order it pays to do it:
Confirm with your firm that trading through a third-party platform is allowed on the account you mean to use.
Trade the simulator first. It runs the same ticket, the same chart trading and the same rules on live prices.
Set the Risk Manager — a daily loss limit at minimum. Once applied it cannot be raised until the next trade window. See The Risk Manager.
Check the account on the ticket. Every simulated account carries Sim in its name; if the ticket does not say Sim, the order is real.
Know which contract you are trading. The instrument at the top of the ticket is the one that gets traded, and it need not be the one on the chart — read the ticket, not the chart title.
Warning
A live account puts a red edge on the strip and asks for one confirmation per window before the first order leaves. After that, orders route on the click.
Placing an order
The ticket. 1 open quantity, open and daily P&L · 2 quantity · 3 the account (Sim means simulated) · 4 BUY column · 5 SELL column, each by order type · 6 Cancel orders · 7 Close & Cancel All · 8 OCO Strategy (the Advanced plan) · 9 Mode · 10 stop-loss · 11 take-profit.
Set the quantity in contracts.
Pick the type: MKT, LMT, STOP or STP LMT.
For a market order press BUY or SELL and it routes.
For a resting order, press BUY or SELL and then click the chart at the price: the level follows your cursor and the click places it. Esc or a right-click cancels the placement.
Buy and sell carry the same colours as the candles, so the ticket and the chart speak one language.
Brackets — stops, targets and OCO
The SL/TP section attaches a stop-loss and a take-profit to the entry, in ticks or in dollars, linked OCO so one filling cancels the other. Choose SL only or TP only when you want one side. A resting entry can carry a pre-set bracket — drag its dotted SL on fill lines before the entry ever fills and the bracket spawns with the position.
Once in a trade: Breakeven moves the stop to the entry; Add stop-loss here and Add take-profit here on the chart’s right-click menu attach one at the clicked price; Move stop to breakeven is there too.
Your position on the chart
Short 2 MNQ on an NQ chart, filled at the close of a bar earlier in the afternoon: the position row at the entry with its quantity and live P&L, the SL line just above the afternoon’s high, the TP line below where price is now, × on each to cancel or flatten. The ticket beside it reads the same −2 and the same P&L. Real NQ tape, recorded through Rithmic in September 2026 — shown to illustrate the software, not a forecast or a trading recommendation. Chartveil does not provide or resell market data.
Your position lives on the chart: a row with live P&L, draggable stop and target lines, and a × that flattens. Drag a line to move the order; the ticket updates; right-click an order for Cancel this order. FLAT on the ticket closes the position; Close & Cancel All flattens and pulls every working order; CANCEL ORDERS pulls the orders and leaves the position.
Chart one contract, trade the other
Chart NQ and trade MNQ from the same window. A mini and its micro are the same underlying at the same price with the same tick size, so every level, study and fill lines up; what changes is money per tick. The position, stop and target draw on the chart you are watching, and the P&L is computed at the traded contract’s point value, not the charted one’s. It is the better way round: the mini carries the real volume so the footprint, delta and heatmap read properly, while the account trades size it can afford.
Modes
Ticks / Money — how the bracket distances are entered.
Advanced — wraps every entry in the saved exit strategy: several targets, breakeven and a trail. See Exits, sizing & sounds.
How orders are filled
Broker account — orders route to your firm through your credentials. Positions and P&L read back from the firm, so the platform shows the same numbers your account does. The broker’s reported position is the truth: a stop-out or a close made elsewhere is seen on the next tick, not fought.
Simulated account — real prices, simulated fills.
The journal captures every fill on both, netted into round trips.
The ledger
Open P&L and Daily P&L are computed at the traded contract’s point value; zero reads grey rather than green or red. A Risk Manager lockout greys the entry buttons and refuses new entries; FLAT keeps working.
Trading
Exits, sizing & sounds
A saved exit plan that every entry carries, sizing by what the trade may lose, and hearing what your orders did.
Automated exits — the Advanced strategy
The Advanced strategy: a stop, three targets with their shares, breakeven and the trail — all in ticks from the entry.
Switch the ticket to Advanced mode and every entry is wrapped in one saved plan:
a stop, in ticks from the entry;
up to three targets, each with a share of the entry size — the shares are percentages, normalised to whole contracts when the order goes in, so a plan written once works whether the trade is one contract or ten;
stop management: the stop resizes as targets fill, moves to breakeven after a set gain, and a trailing stop that only ever moves toward the trade.
Everything is in ticks from the entry, because that is how a trade gets planned out loud — stop eight, first target twelve — and it then applies unchanged to any contract. Edit it with Edit strategy… on the ticket; the plan is shared by every ticket and saved with your config. Build it once, and every entry carries it.
Sizing by risk
Risk mode turns the question around: you say what the trade may lose, in dollars, click the stop level on the chart, and the size is computed from the distance at the traded contract’s point value. It always rounds down — if even one contract busts the number, it places nothing and says so.
Order sounds
The platform can say what happened to an order — spoken aloud, as a chime, or with sound files of your own — so you can watch the tape instead of the ladder. Set it under right-click → Chart settings… → Sounds. Nothing to install; it uses the voice already in Windows.
Event
On by default
Order filled
yes
Partial fill
no
Order submitted
no
Order modified
no
Order cancelled
yes
Order rejected
yes
Stop-loss filled
yes
Target filled
yes
Position flat
yes
Position reversed
no
Trading locked
yes
Each event is its own switch; the chatty ones are off by default. The copier’s refusals, orphans and locks, the GEX wall and flip crossings, and alerts have their own rows. Three ways to say it: Voice (the Windows speech engine, pick the voice and the rate), Chime (rising for a fill or a target, falling for a cancel or a stop, a low double for a rejection), or My files (your own .wav files in a folder, named for the event — filled.wav, rejected.wav…). You can limit sounds to live accounts only or the simulator only.
Historical orders on the chart
Right-click → Historical orders draws every closed trade from the journal on the bars it happened on; History settings… picks the account, the reach-back in days and the exit label. See Charts.
Trading
The Risk Manager
One rule book over every account — daily loss and profit limits, session blocks, blocked instruments and a cooldown — that cannot be loosened once it starts hurting.
The Risk Manager is one set of rules over every account, live and simulator alike, set from the Command Center’s Risk menu. The Risk chip in the Command Center’s frame reads watching, cooldown or off; click it for the rule book and today’s numbers.
The rules
The Risk Manager: today’s numbers, the daily limits, session blocks, blocked instruments and the cooldown. Applying is one-way.
Rule
What it does
Daily loss limit
In dollars. Hitting it closes every position, cancels working orders and blocks new entries until the next session open at 18:00 ET.
Daily profit target
The same, on the way up — a day that has made its number is over.
Session blocks
Refuse new entries during the Asia, London or New York hours you choose.
Blocked instruments
Refuse new entries on any of the twelve contracts — NQ, ES, YM, RTY, GC, SI and their micros — outright. Each is its own switch, so blocking NQ leaves an MNQ ticket alone.
Cooldown
Refuse new entries for a set number of minutes after a losing trade, or after every trade, counted from the fill that closed it. Nothing is flattened and resting orders are left where they are.
Applying is one-way
Rule
Once applied, the rules are frozen until the next trade window. A limit cannot be raised after it starts hurting. That is the point.
Set the limits before the session, not during it.
What a lockout does and does not do
New entries are refused on the ticket, the chart, the ladder, the copier’s followers and the Auto Trader. The ticket’s entry buttons grey; the ladder paints a banner.
Orders that close or reduce a position always go through. FLAT and FLATTEN keep working. A lockout never traps the position it fired on.
The lockout clears at the next session open, 18:00 ET.
Per-account rules
The Risk Manager sits above the accounts. A simulated account can carry its own funded-program rule book — drawdown, daily loss on equity or realised, profit target, consistency, contract caps — that locks or fails the account the way the program would. See Accounts & the simulator. The copier and the Auto Trader add per-follower and per-deployment risk books on top, and all of them follow the same principle: a lock blocks entries only; exits always run.
Trading
Alerts
An alert belongs to the market, not the window — a price, a drawn line, a level that moves, a study, a strategy signal, a big print or a wall — delivered on the chart, spoken, as a Windows notification and a taskbar flash.
An alert is a condition on a market, not on a window. Set from any NQ chart, it shows its bell on every NQ chart, stays armed when the chart closes, and re-arms at the next launch. The micro evaluates the mini’s alerts, so an MNQ chart carries NQ’s.
Arming one
Alt-click the price axis on any chart to arm a one-shot alert at that price.
Right-click a price → Alert at 20,405.00… for the full sheet.
Right-click a drawn line → Alert when price crosses: the line itself is the alert, and it follows the line when you move it.
Alert on ▸ on the chart menu for the other kinds below.
Alt+A opens the alert list; the Command Center’s Alerts tile opens the same list with what fired today.
The sheet
The alert sheet. 1 Watch · 2 what to watch — a price here; a level, a study, prints, a wall or a strategy beside it · 3 When — cross, cross ↑, cross ↓ or touch · 4 Then — once or every time · 5 Expires · 6 Tell me — chart banner, sound, Windows notification, taskbar flash · 7 Arm alert.
Field
Choices
Price
The level, in the instrument’s ticks
Trigger
Crossing, Crossing ↑, Crossing ↓, or Touching
Repeat
Once, or Every time
Expires
When the alert retires itself
Delivery
A banner on the chart, spoken, a Windows notification, and a taskbar flash — each on its own switch
What can be an alert
A price crossing or touching a level.
A drawn line — trend line, ray, horizontal line — that moves with the drawing.
A named level that moves — VWAP, POC, VAH and VAL, the session high and low, the initial balance, yesterday’s levels, the GEX walls and the flip.
A study’s output against a value, crossing up or down.
A Studio strategy’s signal flipping.
A big print of at least N contracts.
A wall of at least N contracts appearing or pulled within a few ticks of price.
Delivery
When an alert fires: a banner appears top-center of every chart of that market and the alert’s line and bell go amber for six seconds; the alert’s text is spoken through the voice, chime or files you picked under Chart settings → Sounds; a native Windows notification arrives through the Chartveil tray icon — click it and the chart comes forward; and the taskbar flashes. Several alerts firing on the same print become one spoken sentence (three alerts on NQ) and one notification with a line per alert.
The tray icon’s menu carries Pause all alerts for the times you want quiet; no money action lives in the tray.
Rules worth knowing
Crossing means crossing — the previous print on one side, this one at or past the level.
An every-time alert re-arms only after price has moved a few ticks away, so a chop through the level fires once per excursion.
A level crossed while the platform was closed is listed as missed in grey rather than fired late.
Managing the list
The alert list: every alert with its condition, its repeat and expiry, and its delivery channels.
The alert list shows every alert — Armed, Paused, Fired, Missed — with Pause, Resume, Re-arm, Edit… and Delete alert on each row’s menu, and Clear this level on the chart’s price menu. VeilGEX arms its own from its Alerts ▾ menu — a wall or the flip crossed, or the flip moving by more than a set number of points.
Trading
Trade Copier
Trade one account and the others you own follow — in copy groups, sized per follower, with exits that fit what each follower actually holds and a kill switch you have to hold.
The copier. 1 Share today · 2 Pause entries · 3 HOLD · FLATTEN ALL · 4 the master switch · 5 the group rail · 6 the leader · 7 the follower rows: account, rule chips, position · match · 8 the activity feed · 9 Dry run. Generated data, for illustration — not market data, a forecast or a trading recommendation.
The copier mirrors one account’s orders across the rest, for traders running several funded accounts at once. It mirrors between accounts you own; copying to third parties is a regulated activity and is not what this is for. Simulated accounts work on either side, so the whole leader-and-followers arrangement can be rehearsed without an order leaving the machine.
Open it from the Command Center’s Trade copier tile or as a tile on the Veil Desk.
How it reads
Top-down:
The band says the copier’s state in one sentence — how many groups, how many followers, what is paused — with Share today, Pause entries and the hold-to-flatten kill switch pinned where it can never be clipped.
The group rail — your copy groups; each is on or off under one master switch.
The leader on its own line — the account the ticket is on, or one you pin.
One row per follower, carrying its rules as chips and whether its position matches the leader’s. Click a row to edit it, risk included.
The activity feed — every mirrored order as it happens, with the reason when one is skipped; it exports to CSV.
Copy groups
Each group has its own leader, its own followers, sizing and rules. Every enabled group leads at once, and copies never cascade — a follower is never a leader for someone else’s group. Groups can be renamed, duplicated in one click and deleted. A group can copy only the markets you name.
Sizing per follower
Mode
The follower trades
Multiplier
The leader’s size × a factor
Fixed size
The same number of contracts every time
Same money
The same dollar exposure, mapped across minis and micros — Trade as minis or micros
A cap per order and a cap per position bound entries, never exits.
Exits fit the follower
An exit closes what the follower actually holds, not a blind copy of the leader’s size — accounts that drifted apart still come out flat. A follower added mid-position can catch up to the leader instead of waiting for the next trade.
Risk per follower
Each follower carries its own book: a daily loss lock, a profit lock, a trade cap, a session window and a flat-by time, plus a max slip and an optional delay. A lock blocks new entries only; exits, cancels and flattens always copy. Apply to all gives every other follower in the group the same rules.
Safety
Dry run reports what would have copied without sending anything. Use it before a real account joins.
The flatten buttons have to be held down rather than clicked: HOLD · FLATTEN on one account, Flatten followers for the followers only, and HOLD · FLATTEN ALL — the panic door — which cancels every order and closes every broker-reported position on every account in the group, leaders included, and switches copying off afterwards. It is never greyed.
Pause entries keeps exits copying while nothing new goes in.
A copy that fails is logged with the reason; after three consecutive failures the account is suspended from new entries until you re-save it, and exits are still attempted.
The orphan guard can warn you, or flatten a follower, that is holding a position while every leader it follows is flat.
If the leader sends something the group cannot mirror, the row says so.
Share the day
Share today renders a recap card summing the day across every account in the group as one image, marked as simulated when the accounts were. Nothing is uploaded; the card is a file on your machine.
Automation
Strategy Studio
Write your own indicators and strategies in sandboxed Python, validate them, put them on any chart, and backtest a strategy on that chart's own data.
The Strategy Studio. 1 Indicators · 2 Strategies · 3 + New · 4 parameters · 5 Veil AI · 6 Validate · 7 Save · 8 Run backtest · 9 the results deck · 10 starter templates · 11 the editor. Generated data, for illustration — not market data, a forecast or a trading recommendation.
The Command Center’s Strategy Studio tile opens an editor for your own indicators and strategies. Code runs in a sandbox against the chart’s own candles: it gets the bars as a data frame with pandas and numpy, and nothing else — no imports, no files, no network, no reaching into the platform, and a runaway loop is stopped rather than allowed to freeze anything.
You need to write code, but not much — a working strategy is a few lines, the template is one, and Veil AI will draft one from a sentence. Chartveil does not supply strategies; it supplies the tooling to write, test and run your own.
The window
The rail lists everything you have written with when it last ran and which charts it is on, beside starter templates to fork.
The editor, with parameters beside the code so a variant is a number, not a copy.
Veil AI docked beside the editor: describe the indicator or strategy and it drafts the code; one click inserts it. Nothing runs or saves until you do it.
The deck under the editor: Validate, Save (Ctrl+S), Add to chart, and for a strategy the backtest results.
Drafts save themselves as you type and come back where you left them. Ctrl+N starts a new one; Ctrl+Enter runs the primary action.
Indicators
An indicator computes a line, a band or several from the candles, and whatever it returns is drawn on the chart under its own name, in the picker’s Custom section.
# Custom indicator — compute line(s) from the candles.
# Available: df (open/high/low/close/volume), pd, np, math, params (dict).
# Assign `result` = a pandas Series, a dict {label: Series}, or a list of Series.

length = int(params.get("length", 20))
result = df["close"].rolling(length).mean()
Custom indicators carry their own parameters, so a variant is a number you change on the chart rather than a second copy of the code.
Strategies
A strategy sets a desired position per bar — 1 long, -1 short, 0 flat — and the chart marks every entry and exit.
# Strategy — set `signal` (desired position per bar): 1 long, -1 short, 0 flat.
# Available: df (open/high/low/close/volume), pd, np, math, params (dict).
# This example goes long when a fast MA is above a slow MA (SMA crossover):

fast = df["close"].rolling(int(params.get("fast", 10))).mean()
slow = df["close"].rolling(int(params.get("slow", 30))).mean()
signal = (fast > slow).astype(int)
A strategy shown on a chart re-runs on new bars off the drawing thread.
Validate
Validate runs the code through the sandbox gate and over the open chart’s bars, reports any error with its line, and prints what the code costs per bar. Code that measures over 25 ms a bar is moved to a worker when it runs on a chart, paused after three failures and stopped at 512 MB, so an indicator can be wrong without taking the platform with it. Keep it cheap: vectorised pandas over the frame, not a Python loop over rows.
Backtest on the chart
For a strategy, run a backtest over whatever the open chart holds. The deck shows the equity curve, net, win rate, profit factor, Sharpe, drawdown, expectancy, exposure, fees and every trade listed. Change the data — another interval, another range — and the test re-runs. It reads the same bars the chart draws.
No backtest proves a strategy works. It can tell you an idea failed, which is most of the value; treat a good result as a reason for more scrutiny, not less. Deep-history testing — in-sample and out-of-sample splits, walk-forward, Monte Carlo on stored ticks — is the Backtesting tile, on the way.
From the Studio to the Auto Trader
The strategy that ran in the Studio is the strategy the Auto Trader deploys — on the simulator first if you want. Once deployed, its fills land in the journal tagged by strategy, so its live and simulated record accumulates in the same place as your own trades.
Automation
Auto Trader
Deploy a Studio strategy to trade its own signals — one strategy, one market, one timeframe, one contract count — with brackets, lockouts, a wind-down and a kill switch.
The Auto Trader. 1 the master switch · 2 the next-gate chip · 3 Stop all · 4 the day’s tiles · 5 a deployment row · 6 the row’s controls: Flatten, Armed and the ··· menu (Wind down lives here) · 7 rope meters · 8 the session window · 9 + New. Generated data, for illustration — not market data, a forecast or a trading recommendation.
The Auto Trader executes rules you wrote and can stop at any moment. It does not decide what to trade, and Chartveil does not supply strategies or advice. Whether it may run on a funded account depends on your firm’s rules on automation — check before relying on it.
Open it from the Command Center’s Auto Trader tile or as a tile on the Veil Desk. It runs on all six markets.
A deployment
A deployment binds one strategy to one market, one timeframe and one contract count, on the simulator or on your armed live account. On every completed bar the code runs, its signal becomes the desired position, and the engine reconciles the account’s real net against it with market orders.
Trade management is built in and identical on the simulator and live:
a stop and target as a bracket on the entry;
auto-breakeven after a set gain;
a stepped trailing stop;
optional re-entry after a stop.
The editor prices each setting as you type it: a stop in ticks reads back as dollars at your contract count, and a daily loss limit reads back as the number of stop-outs it allows.
Guardrails — on entries, never on exits
Per deployment: daily loss and profit lockouts, a trade cap, a session window and a flat-by time. A rule that strands a position is the failure it exists to prevent, so exits always run. The Risk Manager sits above all of it.
Manual override, always
The master switch is off at every launch and never restarts on by itself.
Stop all flattens every deployment at once.
The broker’s reported position is the truth: a stop-out or a manual close is seen on the next tick, not fought.
The engine owns only what it opened: contracts you put on by hand are never touched, and it will not enter beside them.
Arming a live deployment
Arming shows the account, the protection and the record it is going live with — how many simulated entries the strategy has taken — and asks you to type the word. The LIVE badge stays hollow until it is actually armed.
Warning
Run every strategy on the simulator first. The sandbox stops a bug reaching anything but its own signal, the guardrails cap what a wrong signal can cost in a day, and the kill switch stops it outright — but the simulator is where you find out.
The console
The day in four tiles, then every deployment as a row that says in words what it is doing — in a position, waiting for the next bar, locked out for the day, or stopped on an error. Under it, four cells: the position with its average, stop and target; the P&L; meters for how much of the daily loss and the trade cap it has used; and its session window as a track with the clock on it. A chip in the strip names the next gate any deployment will hit and when.
The activity rail logs every decision, folds the repeated skips, and filters to trades, risk or everything.
Wind down
Wind down on a row’s menu tells a deployment to finish what it is in and take nothing new: it keeps managing the open position, switches itself off the moment it is flat, and never sends a flatten to get there.
Where the record goes
Every fill lands in the journal tagged by strategy, so a deployment’s live and simulated record accumulates beside your own trades.
Record & assistant
Trade Journal
Every fill journaled automatically — live and simulator — netted into round trips and put through the statistics a quant would run, with what the sample can show and what it cannot yet.
The journal. 1 the account chip · 2 the tabs — Overview, Trades, Days, Edge, Execution, Insights, Models · 3 the range · 4 + Filter · 5 saved Views · 6 Export · 7 Veil AI. Generated data, for illustration — not market data, a forecast or a trading recommendation.
Nothing to fill in. Every fill on a live account or the simulator is captured on its own and netted into round trips — scale-ins averaged, flips split — each keeping the stop and target it was opened with, the exit reason, slippage against what you intended, and how far it went for and against you before it closed. Simulated trades are always labelled as simulated.
The journal opens from its tile in the Command Center, or as a tile on the Veil Desk beside the chart you are trading. It reads cleanly at any width, down to a narrow tile.
Where it lives
On your machine, in the config folder — your trading record does not leave your computer. Export gives it to you as CSV, JSON or Parquet whenever you want it somewhere else. Captured facts are sealed: prices, size, times and P&L come from the feed and cannot be edited. Your notes, tags, grades and plan stay yours.
Import CSV brings past trades in from another platform. It accepts common broker-export shapes, refuses duplicate re-imports, and keeps imported trades distinct from the fills the platform captured itself.
The tabs
The Trades tab: round trips grouped by day with entry → exit, hold, net P&L, R, the exit reason, MFE/MAE, setup and tags. Generated data, for illustration — not market data, a forecast or a trading recommendation.
Tab
What it holds
Overview
The report card: KPI cards, the Veil Score with its weakest part named, the equity curve with drawdown, the month calendar, daily bars and the top three findings
Trades
The sortable table — P&L, R, exit reason, plan — and the review panel
Edge
Is it real: confidence intervals on every headline number, cohort comparisons tested against the rest, Bayesian win-rate odds per setup, the rolling edge monitor and kill criteria
Execution
Entries and exits: MFE and MAE, exit efficiency, what was left on the table, the what-if rule engine, discipline and cost per mistake, hold time and slippage
Insights
The week against the prior four, ranked plain-English findings, and every breakdown — by hour, setup, session, side, exit reason
Models
Monte Carlo projections and funded-account evaluation odds from your own daily results — pass rates, days to target, the odds of the drawdown that ends a run
Days
Notes that belong to a session rather than to one trade
Badges on the tabs count what is still unreviewed.
Reviewing a trade
Open a trade and it is drawn on the bars it happened on — entry, stop, target and exit against the price that followed — beside the facts. ↑ and ↓ walk the day trade by trade, Enter opens the review, Ctrl+S saves it. The review panel takes the setup, tags, emotion, stars, whether the plan was followed, mistake chips, an execution grade, and a manual stop and target for R when no bracket was on the book.
Filters and views
Filter by date, instrument, session, setup or tag, and by account — pick several under Combine accounts… and every statistic, streak and calendar reads on the union, with one chip naming the set. Save a filter under a name and the view you keep coming back to is one click; views remember which accounts they were built on.
The calendar
Every day carries a strip of its trades in the order they closed, so a green day made of one lucky trade looks different from a green day made of six. Streaks run as rails across the days they lasted, each week has its own rail with a mini chart, and the month reads in dollars, in R or as the average per trade — switch at the top. The Privacy switch hides the figures for a screenshot; Share month renders the whole month as one image.
Small samples
The Edge tab: confidence intervals on every headline number, and each cohort tested against the rest. Generated data, for illustration — not market data, a forecast or a trading recommendation.The Models tab: path risk, the Monte Carlo equity fan, and pass odds for the funded-account evaluations, from your own daily results. Generated data, for illustration — not market data, a forecast or a trading recommendation.
Every headline figure carries its interval, and when you split the record by hour, setup, session, side or exit reason each group is tested against the rest. A “bad hour” with eleven trades behind it is reported as a lead, with the number of trades it would take to confirm it — the journal does not round a small sample up into a verdict. It will tell you what the sample supports, not your edge.
Sharing
A share card renders one trade as an image or a short replay; Share month renders the calendar. Both carry the wordmark and are marked as simulated when the trade was; with the privacy switch on, the dollar figures are hidden. Nothing is uploaded — the card is a file on your machine that you post wherever you like.
Veil AI in the journal
Open the Veil AI dock inside the journal and it sees the statistics you have on screen — expectancy, sessions, setups, streaks, execution — and reads them like a coach: what the sample can show, and what it cannot yet. See Veil AI.
Record & assistant
News & the economic calendar
Today, Week and Headlines on Chartveil's own economic calendar, a countdown to the next high-impact release, the 15-minute reaction beside every release that has printed, and spoken warnings if you want them.
The News pane and the Veil Economic Events study are driven by the same calendar. It works offline; nothing is extrapolated past what is published.
Opening it
From the Veil Desk’s + Add menu, from News in a chart header, from Open beside ▸ on a docked chart, or by clicking the countdown chip on a chart’s quote tape.
The three views
The News pane on Today: the countdown to the next high-impact release and the day’s schedule on the ET clock.
Today lists the day’s scheduled releases with a countdown to the next high-impact one and, once a release has printed, the market’s fifteen-minute reaction in points beside it.
Week is the calendar ahead. A confirmed date draws solid; an estimated one draws dashed with a ?.
Headlines is an opt-in feed of public wires — off until you switch it on under Chart settings → Data.
Release chips
Inside the last hour before a high-impact release the quote tape, the Time & Sales header and the ladder header carry a release chip with the countdown, so the number is in front of you wherever you are looking.
Spoken warnings
Five- and one-minute warnings, spoken through the same voice as the order sounds, are under Chart settings → Sounds. They are off by default.
Data settings
Chart settings → Data holds two opt-ins:
a free statistics key so past markers and releases also carry the actual and previous prints as they were first published;
the headline feeds behind the Headlines view.
Neither is needed for the schedule itself.
Record & assistant
Veil AI
An assistant inside the terminal that explains order flow and the platform, reads your journal, interprets the VeilGEX map and drafts Studio code. It explains and drafts; it does not trade and does not advise.
Veil AI. 1 + New chat · 2 the Sees chip naming what it is told about your screen · 3 details opens the block that is sent · 4 the model · 5 your balance · 6 send · 7 the standing reminder · 8 the ask box. Generated data, for illustration — not market data, a forecast or a trading recommendation.
Veil AI lives next to the Studio, the journal and the VeilGEX map and answers in plain language about order flow, the platform, and what is on your screen.
What it does
Explains order flow — delta, imbalance, absorption, the heatmap, footprints, profiles and dealer gamma — at the depth you ask for, with the platform’s own panels as the examples.
Reads your journal — inside the journal it sees the statistics you have on screen and reads them like a coach: what the sample can show, and what it cannot yet.
Interprets VeilGEX — docked in the VeilGEX window it is primed with the levels on screen.
Drafts indicators and strategies — in the Studio it writes the code for what you describe and inserts it into your editor with one click. Your code, in the Studio’s sandbox; you run it, you save it.
What it will never do
It never places or changes an order, never changes a setting, never sees your passwords or licence key, and does not give trading advice. Ask it for a direction and it lays out the competing readings and what would confirm each — the decision stays yours. It has no way to reach your orders, your Risk Manager, your copier or your account; the only thing it can put into the platform is a code draft in the Studio editor, and only when you click to insert it.
It can be wrong. It is an assistant, not an authority — verify anything you would act on, and treat its reading of a chart as one more opinion at the desk.
Opening it
The Command Center’s Veil AI tile opens it in its own window; Ctrl+/ shows or hides the panel wherever it docks — the chart, the journal, the Studio, VeilGEX, the Veil Desk. Enter sends; Shift+Enter is a new line. Every conversation is saved on your computer, so you can pick any of them back up.
What it can see
Every panel it opens in carries a chip naming exactly what it is being told about your screen — the chart, the journal filter you are on, the GEX map — and the chip opens the block that gets sent. If the chip does not name it, it is not sent.
Four models
Pick the model per question: Quick for look-ups, Standard for everyday, Deep for code and full reviews, Max when you want the strongest answer. The cost of each reply is shown under it.
Cost and privacy
Usage is included in every plan and metered against a balance that resets each billing period; a typical Standard reply is a few cents. Run out and you can add balance from the Veil AI tab of your account on the site. Nothing is charged to your card unless you buy a pack or turn on auto-reload yourself. See Account & billing.
Your conversation history is saved on your computer only. To answer, the question and a small block of the numbers on the screen you are asking about are sent to Chartveil and on to our model provider. Your market-data credentials, passwords and licence key are never sent; the app removes anything that looks like one before it leaves. We keep a usage ledger — when, which tier, what it cost — because that is what your balance is made of, not the text. The privacy policy has the detail.
Reference
Keyboard & mouse
Most of the platform is driven by the mouse; the few keys that matter are the same in every window.
Esc never sends an order and never flattens: it only takes back the thing you were in the middle of. Flatten is a button, on the ticket and on the ladder.
Chart
Do this
Result
Wheel
Zoom time, anchored on the bar under the cursor
Drag the body / drag the price axis
Pan / zoom price by hand
Double-click the price axis
Refit the scale to the visible bars (a study pane’s axis too)
Double-click the divider under a study pane
Back to automatic pane sizing
Alt+click the price axis
Arm a one-shot alert at that price
Alt+A
Open the alert list
Ctrl+,
Chart settings
Ctrl+/
Show or hide the Veil AI panel
Delete or Backspace
Remove the selected drawing
Esc
Cancel the order you are placing, then deselect
Shift+Enter while editing text
New line in a text drawing
Chart tabs
Do this
Result
Ctrl+T
New chart in a tab
Shift+click + / Ctrl+Shift+N
New chart as a window
Ctrl+Tab / Ctrl+Shift+Tab
Next / previous tab
Ctrl+PgDn / Ctrl+PgUp
Next / previous tab
Ctrl+9
Last tab
Ctrl+W
Close the tab
Ctrl+Shift+T
Reopen the last closed tab
Ctrl+Shift+D
Move the tab to its own window
Heatmap
Do this
Result
Wheel over the map / Ctrl+wheel
Zoom time
Wheel over the price scale
Zoom price around the cursor
Shift+wheel
Pan price
Drag / double-click
Pan both axes / snap back to the live edge
Esc
Cancel the order or drag in progress; return to the live edge
Ladder
Do this
Result
Wheel / Ctrl+wheel
Scroll the ladder (it detaches from the market) / resize the rows
Home, double-click or the ⊙ button
Recenter on the inside market
+ and −
Step the order quantity while Trading is on
Esc
Cancel the order being confirmed, otherwise cancel every working order
Veil Desk
Do this
Result
Esc while dragging a tab
Drop the drag where it started
Double-click a tab
Maximise the tile; again to restore
Journal, Studio, Veil AI
Where
Do this
Result
Journal
↑↓ / Enter / Ctrl+S
Move through trades / open the review / save the review
Studio
Ctrl+S / Ctrl+Enter / Ctrl+N
Save / run the primary action / new
Veil AI
Enter / Shift+Enter
Send / new line
Reference
Files, updates & seats
Where the platform keeps things, how updates arrive, and how the seat on your plan moves between machines.
Where things are kept
Everything the terminal writes lives in %LOCALAPPDATA%\Chartveil on the machine it runs on:
Folder
Holds
Worth backing up?
config
Your settings, workspaces, drawings, indicator templates, accounts, the exit strategy, custom indicators and the journal
Yes — small, and the part that is yours
cache
Recorded tick history and depth
No — large, and rebuilt from the feed
logs
What the problem report reads from, and crash.log if there has ever been one
No
Uninstalling leaves the folder in place on purpose; delete it yourself for a clean slate.
Moving to a new PC
Install from the dashboard, sign in with the same licence, and copy the config folder across if you want your desk exactly as it was. A single layout can travel on its own as a shared workspace. Nothing about your account is tied to the old machine.
Updates
The terminal checks on every launch. When a newer stable build is out it tells you before it opens, downloads the installer itself and hands over to it — press Install and it installs and reopens. Your settings, workspaces and journal are kept. If the download will not start, take the installer from the dashboard instead. Either way it takes a minute, so do it before the session rather than at the open.
The terminal only runs a build we currently serve, so a fix that matters is never left behind on one machine. What changed in each release is on the changelog.
Note
Builds before 0.9.13 download the new installer and then fail to launch it. If you are on one of those, take 0.9.13 or later from the dashboard once; from then on Install update works from inside the platform.
Stable and beta builds both install to the same place, so running either installer switches you to that build, and one licence covers both.
Seats
Install on as many of your own computers as you like. The plan limits how many copies run at the same time — one on Veil Chart, one on Veil Flow (two on annual), three on Veil Stack.
There is nothing to move and no slot to free up. If a copy is already open elsewhere, the new one tells you which machine has it and offers to take the seat over in one click. Relaunching on the same machine simply takes its own seat back, so a crash, a reinstalled Windows or a new laptop needs no help from us. If the dialog names a machine you do not recognise, tell us straight away — it means your key is being used by someone else.
Offline
Every panel is built from a live feed, so without a connection there is nothing to draw. The licence is forgiving: it checks in with us when the terminal opens, and if our server cannot be reached the build keeps working for two weeks on the last successful check before it asks again.
Reconnecting
Whatever was connected when you closed the platform — the chart feed and your broker sessions — reconnects at launch, and the journal catches itself up on the fills it missed. If the feed drops mid-session the client reconnects and resumes tick paging automatically, backfilling what it missed.
Reference
Troubleshooting
When something looks wrong — the feed, the licence, an empty panel, a slow desk — and how to report a bug usefully.
Windows warned me about the installer
Expected. The installer is not code-signed yet, so SmartScreen shows Windows protected your PC the first time it runs. Click More info, then Run anyway — only for an installer you downloaded from your own dashboard. Some antivirus products quarantine unsigned installers on the same grounds; restore the file and allow it, or download again after adding an exception.
It says I must update before it will open
That is the build check: the terminal only runs a build we currently serve. Press Install — it downloads the current build, installs it and reopens; your settings, workspaces and journal are untouched. If the download will not start, take the installer from the dashboard.
My licence key is refused, or the seat is in use
Refused: the key and the email must be the pair shown on your dashboard, the subscription must be active, and the machine needs to reach the internet for the check — a firewall that blocks the terminal blocks activation too. A subscription whose last payment failed is inactive until the card is updated.
Seat in use: a copy is open on another of your machines — one on Veil Chart, one on Veil Flow (two on annual), three on Veil Stack. The dialog names the machine and offers to take the seat over in one click. If it names a machine you do not recognise, tell us straight away.
My feed login is refused
Work down this list — it is nearly always one of the first three:
Wrong credentials. The dialog wants the Rithmic data login your firm issued, which is usually different from the login for the firm’s own website.
Wrong server. Pick your firm by name in the server list. A funded login on the paper-trading server, or the other way round, is refused.
Maintenance break. Between 17:00 and 18:00 ET the exchange is closed and the chip reads connecting… — wait for the reopen.
The login itself. An evaluation that ended, an account the firm closed, or data fees unpaid all switch the credentials off at their end. Sign in to your firm’s dashboard and confirm the data subscription is active.
My depth panels are empty but charts work
The signature of missing Level 2. Time-and-sales is arriving (so bars and footprints build) but order-book data is not. Ask your prop firm or broker to add Level 2 to your account — and if it is only the gold, silver or Dow panels that are empty, ask for COMEX or CBOT Level 2 specifically. The heatmap’s instrument menu says no depth beside a market the entitlement does not cover.
A chart says “No chart data”
In order of likelihood: the feed is not connected (check the chip in the Command Center); it is the maintenance break; or the contract month you opened has expired and the provider refuses history for it — open the front month. If the feed is up and the contract is live, right-click → Reload chart. Still blank? Send a problem report.
A chart has a hole in it, or a bar that looks wrong
Right-click → Reload chart. The history is requested again and the bars are overwritten in place — drawings, view and scale kept. If the hole comes back, note the time window and send it over.
There are gaps in the book
Almost always the connection. Market-by-order is a heavy stream and wireless links drop packets under load. Move to a wired connection before investigating anything else.
The feed disconnected mid-session
The client reconnects and resumes tick paging automatically, backfilling what it missed. If a hole remains after reconnecting, note the time window and send it over.
The terminal feels slow
Check how many heatmap windows are open — each one is decoding depth. 8 to 16 GB is the recommendation, toward 16 GB for running several alongside charts. Turn down the number of profiles shown on a heavy chart. If it is slow with one window on a machine that meets the requirements, tell us, because that is a bug.
Prices on the scale look wrong
Every price should be a multiple of the instrument’s tick. A value ending in an impossible fraction is a display fault worth reporting with a screenshot.
A study of mine stopped drawing
A custom indicator that fails three times is paused, and one that measures over 25 ms a bar runs on a worker. Open it in the Studio, Validate, and read the cost line.
Reporting a problem
Report a problem: what happened, what gets included, and See exactly what is sent before anything leaves.
From the Command Center, Help → Report a problem… builds a snapshot — version, feed, accounts, open windows and every error in the log — with a note from you. Save it as a file or send it to us; the preview shows byte for byte what leaves, the licence key is masked and passwords are never included.
Writing in instead? Include which panel, which instrument, what you had just done, your OS version, and how many windows were open. “It crashed” costs a round trip.
Warning
Never send your feed password. We will never ask for it.
Reference
Glossary
The terms the panels use.
Absorption
Aggressive volume arriving at a level without price moving through it — someone passive is taking the other side in size. Heavy selling into a low that holds is the textbook case.
Bracket and OCO
A bracket is the stop-loss and take-profit attached to an entry. OCO — one cancels the other — is the link between them: when one fills, the other is cancelled, so a filled target never leaves a live stop behind.
Contract
The unit of size in futures. Chartveil counts everything in contracts — the ticket, the ladder, the footprint cells, the copier’s sizing.
Cumulative delta (CVD)
Delta accumulated across bars. Divergence between price and CVD — a higher high on falling CVD — is a common thing to look for, and a common thing to over-read.
Delta
Volume that lifted the ask minus volume that hit the bid, over some window. Positive delta means aggressive buyers did more of the work. It says nothing about who was right.
Drawdown — trailing and end-of-day
How far an account has fallen from its peak. Funded programs measure it two ways: trailing follows the high-water mark tick by tick, so an open profit that comes back counts against you; end-of-day only moves the mark at the session close. Chartveil’s simulated accounts model both, and static drawdown too.
Flip point — zero gamma
The index level where dealers’ net gamma crosses zero. Above it their hedging tends to lean against moves; below it, to push with them. VeilGEX marks it and can read it as an NQ or ES level.
Footprint
A bar opened up to show, at every price it traded, how much volume hit the bid and how much lifted the ask. Chartveil’s is Veil Print.
GEX — gamma exposure
A measure of dealer options positioning. Heavy positive gamma tends to damp movement as dealers hedge against it; past the flip point that reverses. Context, never a signal.
Imbalance
In a footprint, a cell where one side substantially exceeds the diagonally opposite cell. The default test is 200 % and a minimum raw contract difference, so tiny cells do not trip it.
Level 2
Market depth: the resting orders at prices around the last trade, not just the last trade itself. It is the one entitlement you ask your prop firm or broker for; the heatmap and the ladder are built from it, the charts and footprints are not.
MBO — market by order
A feed carrying individual resting orders rather than a total per price. It is what makes biggest × total possible: without it, one 200-contract order and forty 5-contract orders are indistinguishable.
POC, VAH, VAL
Point of control is the price with the most volume in the range. Value area high and low are the edges of the band holding the configured share of volume around it, grown out from the POC one level at a time.
R multiple
A trade’s result measured against what it risked: a trade that risked $200 and made $400 is +2R. The journal’s calendar can read in R instead of dollars, which makes days on different sizes comparable.
Round trip
One flat-to-flat trade: from the fill that opened a position to the fill that closed it, with everything in between netted. The journal counts in round trips, not fills, which is why a scale-in and a scale-out are one trade rather than four.
Shared tape
Every panel reads the same recorded stream of ticks. It is why the heatmap, the footprint and the ladder always describe the same instant rather than three slightly different ones.
Spoof
Resting size shown to attract price and pulled as it arrives. On a heatmap it draws a streak that ends abruptly the moment price gets close.
Tick and point
A tick is the smallest price step an instrument moves in; a point is a whole unit of price. NQ moves in quarter-point ticks worth $5 each on the full contract, so a point is $20; the micro (MNQ) is one tenth of that. Stops and targets in Chartveil are set in ticks or in dollars.
TPO profile
Time-price-opportunity: a letter-based profile where each letter is a time period that traded at that price. A different view of the same data a volume profile summarises by size.
Value area
The band of prices around the point of control that holds a set share of the session’s volume — 68 % is the one-standard-deviation figure the convention derives from. Its edges are the value area high (VAH) and low (VAL).
Wall
A level holding much more resting size than its neighbours. On the heatmap it is a bright streak; on the ladder the biggest level per side is boxed. A wall that pulls as price arrives was a spoof; one that holds and absorbs is the thing to watch.
Reference
Account & billing
Signing in, the dashboard, the three plans, seats, Veil AI balance, cancelling, and what each plan includes.
Everything about your account lives on the site, not in the terminal. The terminal signs in once with your email and licence key and then stays signed in.
Download — the stable build and, when there is one, the beta, each personalised to your account.
Licence — your key, and which machines hold a seat.
Orders — every payment with its receipt.
Account — your name and password. Your email is the identity your licence, receipts and agreements are tied to, so it is not a self-service field: write to support@chartveil.com from the old address naming the new one.
Veil AI — your balance, and packs to add to it.
Affiliate — apply to the affiliate program, which pays a recurring share of every subscription that starts from your link.
Manage billing — the Stripe billing portal: your card, invoices, switching plan, cancelling. Your card never touches our servers.
Forgotten the password? Forgot password on the login page emails a reset link.
The three plans
Veil Chart — footprint and profile charting with live trading on your own account: Veil Print, Veil Profiles, Bar Stats and every standard study, every bar type, the order ticket and the Risk Manager, the automatic journal (one account at a time), price, drawing and study alerts.
Veil Flow — everything in Chart plus the live book: the Liquidity Heatmap, Veil Depth, the Advanced DOM and Time & Sales, VeilGEX and the gamma studies, the Veil Desk, big-print and wall alerts, the journal across every account, and $5 of Veil AI a month ($110 a year on annual).
Veil Stack — everything in Flow plus the Trade Copier, the Auto Trader and the Strategy Studio (custom indicators and strategies, strategy alerts), deep-history backtesting when it lands, $15 of Veil AI a month ($330 a year on annual), three copies at once and priority support.
Every plan keeps every market, replay, news, the prop-firm comparison and every update. A tool your plan does not include stays where it is in the terminal — on its Command Center tile, in the desk’s Add menu, in the study picker — with the plan it belongs to named beside it; the click opens a card with See plans and I have upgraded, which re-checks the licence on the spot. Nothing on a lower plan is a cut-down version of something above it.
Changing plan is the Change plan button on the dashboard’s Subscription tab. Moving up takes effect at once — you pay the difference for the rest of the period and the new tools unlock without a reinstall. Moving down takes effect when the paid period ends, so a copier group or a deployed strategy is never switched off mid-day. The locked launch rate carries to the new plan. macOS, web and iOS are not a separate licence when they ship.
Not included: market data. The connection is built in, but the data and exchange fees on your own account are billed by your broker or prop firm directly, and you sign in with the credentials they issue.
Seats
One copy at once on Veil Chart, one on Veil Flow (two on annual), three on Veil Stack, on as many of your own machines as you like. See Files, updates & seats.
Payment
If a payment fails, your access stays on while Stripe retries over the following days, with an email each time. If the last attempt also fails the subscription stops and the licence stops working; updating the card from the dashboard starts it again immediately and nothing has been deleted.
Changing plan or billing period is one button on the dashboard, Change plan; a move down, including annual to monthly, is scheduled for the end of the paid period.
Cancelling
Any time, from the Stripe billing portal linked from your account and from every receipt — two clicks, no approval needed. It takes effect at the end of the current billing period and you keep access until then. Uninstalling does not cancel the subscription.
All sales are final, on first payments and on renewals, because access starts the moment payment succeeds; the terms have the wording. Charged when you did not expect to be? Write to sales@chartveil.com with the receipt and a person will look at it.
Deleting your account
Cancel first so nothing renews, then write to us from the account’s email asking for deletion. Your account, licence and device records are removed; payment and agreement records that tax and consumer law require us to keep are retained for as long as they require. The journal, workspaces and settings on your own computer are yours and are not touched by any of this. The privacy policy lists every right you have over your data.
Prices
Current prices, the launch rate and how it is locked are on the pricing page.
Risk Disclosure. Futures trading involves substantial risk of loss and is not suitable for every investor. Past performance is not indicative of future results. Chartveil does not provide trading advice, signals, or recommendations. Chartveil is not a broker: any order placed through the software is placed on your own instruction, into your own account, through your own broker or prop firm. Any simulated or hypothetical results have inherent limitations and do not represent actual trading. You are solely responsible for your own trading decisions.